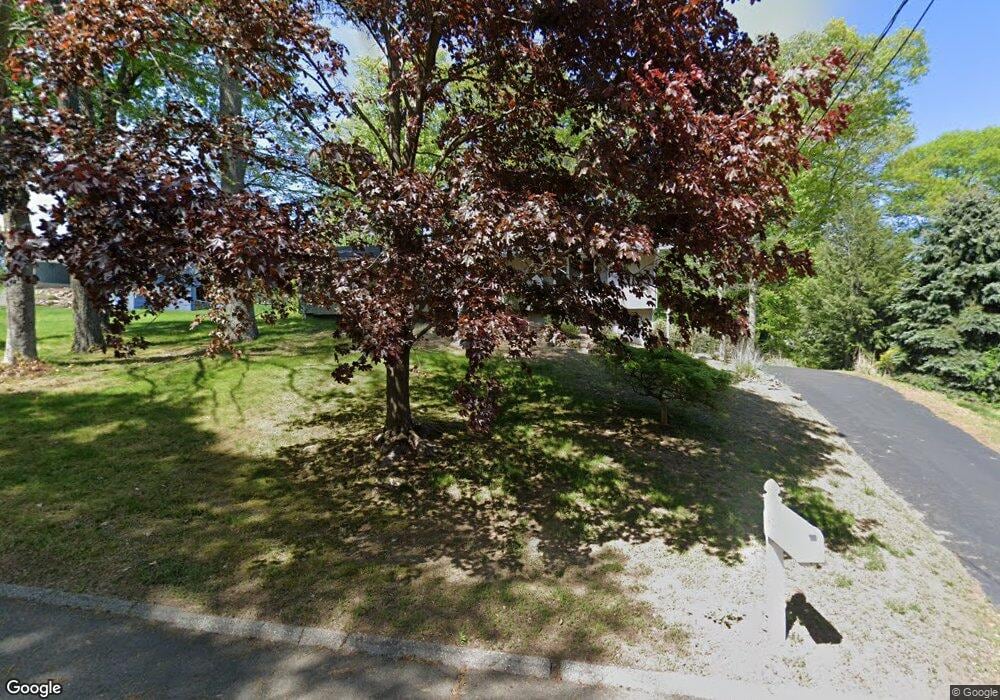
40 Stemway Rd Trumbull, CT 06611
Estimated Value: $525,000 - $693,000
3
Beds
3
Baths
1,608
Sq Ft
$394/Sq Ft
Est. Value
About This Home
This home is located at 40 Stemway Rd, Trumbull, CT 06611 and is currently estimated at $633,204, approximately $393 per square foot. 40 Stemway Rd is a home located in Fairfield County with nearby schools including Tashua School, Madison Middle School, and Trumbull High School.
Ownership History
Date
Name
Owned For
Owner Type
Purchase Details
Closed on
Oct 22, 2012
Sold by
Ferrante Adeline
Bought by
Ferrante Adeline
Current Estimated Value
Home Financials for this Owner
Home Financials are based on the most recent Mortgage that was taken out on this home.
Original Mortgage
$129,050
Outstanding Balance
$56,486
Interest Rate
3.57%
Estimated Equity
$576,718
Purchase Details
Closed on
May 17, 1999
Sold by
Jose Barbara
Bought by
Ferrante Albert and Ferrante Adeline G
Home Financials for this Owner
Home Financials are based on the most recent Mortgage that was taken out on this home.
Original Mortgage
$176,000
Interest Rate
6.92%
Create a Home Valuation Report for This Property
The Home Valuation Report is an in-depth analysis detailing your home's value as well as a comparison with similar homes in the area
Home Values in the Area
Average Home Value in this Area
Purchase History
| Date | Buyer | Sale Price | Title Company |
|---|---|---|---|
| Ferrante Adeline | -- | -- | |
| Ferrante Albert | $279,000 | -- |
Source: Public Records
Mortgage History
| Date | Status | Borrower | Loan Amount |
|---|---|---|---|
| Open | Ferrante Albert | $129,050 | |
| Previous Owner | Ferrante Albert | $164,000 | |
| Previous Owner | Ferrante Albert | $176,000 |
Source: Public Records
Tax History
| Year | Tax Paid | Tax Assessment Tax Assessment Total Assessment is a certain percentage of the fair market value that is determined by local assessors to be the total taxable value of land and additions on the property. | Land | Improvement |
|---|---|---|---|---|
| 2025 | $9,990 | $271,880 | $155,680 | $116,200 |
| 2024 | $9,708 | $271,880 | $155,680 | $116,200 |
| 2023 | $9,553 | $271,880 | $155,680 | $116,200 |
| 2022 | $9,399 | $271,880 | $155,680 | $116,200 |
| 2021 | $8,323 | $228,900 | $132,090 | $96,810 |
| 2020 | $8,163 | $228,900 | $132,090 | $96,810 |
| 2018 | $7,981 | $228,900 | $132,090 | $96,810 |
| 2017 | $7,833 | $228,900 | $132,090 | $96,810 |
| 2016 | $7,632 | $228,900 | $132,090 | $96,810 |
| 2015 | $7,440 | $222,300 | $132,100 | $90,200 |
| 2014 | $7,283 | $222,300 | $132,100 | $90,200 |
Source: Public Records
Map
Nearby Homes
- 39 Zephyr Rd
- 230 Fitch Pass
- 440 Pitkin Hollow
- 4725 Madison Ave
- 132 Merrimac Dr
- 6475 Main St
- 16 Deepdene Rd
- 0 Main St
- 21 Histon Rd
- 71 Cider Mill Ln
- 78 Old Tree Farm Ln
- 253 Mayfield Dr Unit 253
- 177 Mayfield Dr
- 40 Rose Terrace
- 215 Fernwood Rd
- 6716 Main St
- 100 Tashua Rd
- 184 Putting Green Rd
- 93 Putting Green Rd N
- 102 Coventry Ln
Your Personal Tour Guide
Ask me questions while you tour the home.