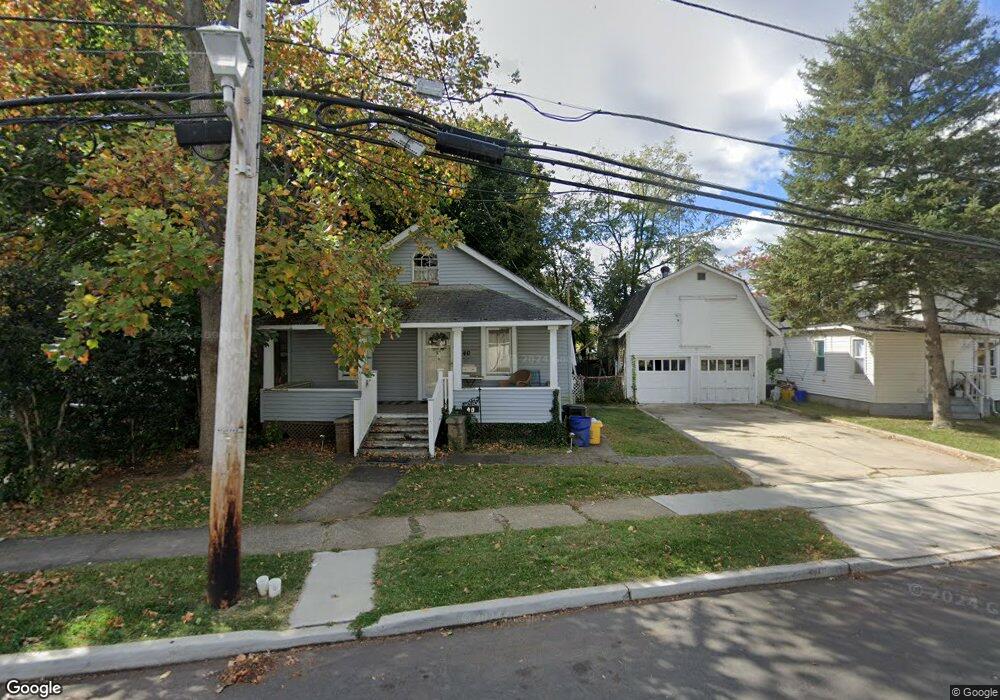
40 Stokes St Freehold, NJ 07728
Estimated Value: $389,000 - $423,000
2
Beds
1
Bath
936
Sq Ft
$435/Sq Ft
Est. Value
About This Home
This home is located at 40 Stokes St, Freehold, NJ 07728 and is currently estimated at $406,699, approximately $434 per square foot. 40 Stokes St is a home located in Monmouth County with nearby schools including Park Avenue Elementary School, Freehold Intermediate School, and Freehold Borough High School.
Ownership History
Date
Name
Owned For
Owner Type
Purchase Details
Closed on
Jul 30, 2020
Sold by
Norris John A
Bought by
Norris Susan K
Current Estimated Value
Purchase Details
Closed on
Apr 11, 2003
Sold by
Hanley Catherine
Bought by
Norris John and Norris Susan
Home Financials for this Owner
Home Financials are based on the most recent Mortgage that was taken out on this home.
Original Mortgage
$170,500
Outstanding Balance
$72,654
Interest Rate
5.64%
Estimated Equity
$334,045
Create a Home Valuation Report for This Property
The Home Valuation Report is an in-depth analysis detailing your home's value as well as a comparison with similar homes in the area
Home Values in the Area
Average Home Value in this Area
Purchase History
| Date | Buyer | Sale Price | Title Company |
|---|---|---|---|
| Norris Susan K | -- | None Available | |
| Norris John | $179,500 | -- |
Source: Public Records
Mortgage History
| Date | Status | Borrower | Loan Amount |
|---|---|---|---|
| Open | Norris John | $170,500 |
Source: Public Records
Tax History Compared to Growth
Tax History
| Year | Tax Paid | Tax Assessment Tax Assessment Total Assessment is a certain percentage of the fair market value that is determined by local assessors to be the total taxable value of land and additions on the property. | Land | Improvement |
|---|---|---|---|---|
| 2025 | $6,786 | $386,100 | $279,500 | $106,600 |
| 2024 | $6,354 | $338,100 | $233,500 | $104,600 |
| 2023 | $6,354 | $303,000 | $200,800 | $102,200 |
| 2022 | $5,325 | $224,600 | $131,600 | $93,000 |
| 2021 | $5,325 | $203,000 | $114,400 | $88,600 |
| 2020 | $5,295 | $198,900 | $114,400 | $84,500 |
| 2019 | $4,937 | $186,300 | $104,400 | $81,900 |
| 2018 | $4,991 | $184,800 | $104,400 | $80,400 |
| 2017 | $4,985 | $183,800 | $104,400 | $79,400 |
| 2016 | $5,191 | $195,500 | $122,500 | $73,000 |
| 2015 | $5,030 | $198,500 | $125,500 | $73,000 |
| 2014 | $4,802 | $198,500 | $125,500 | $73,000 |
Source: Public Records
Map
Nearby Homes