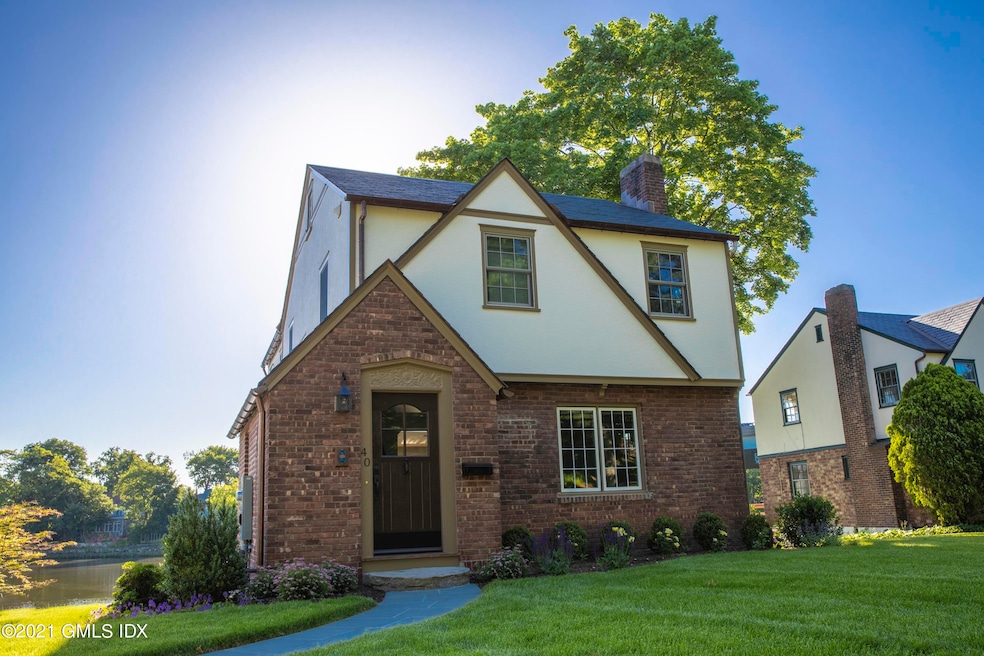
40 Strickland Rd Cos Cob, CT 06807
Highlights
- Home fronts a pond
- Tudor Architecture
- 1 Car Attached Garage
- Cos Cob School Rated A
- 1 Fireplace
- 1-minute walk to Bush-Holley Historic Site and Visitor Center
About This Home
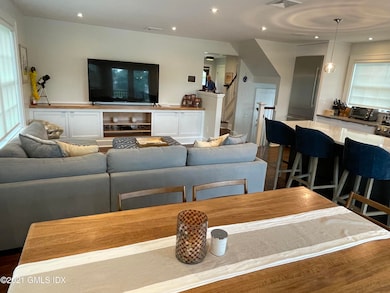
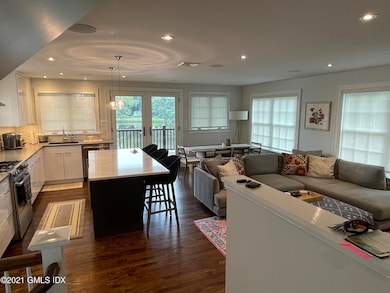
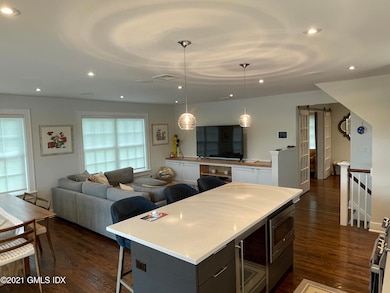
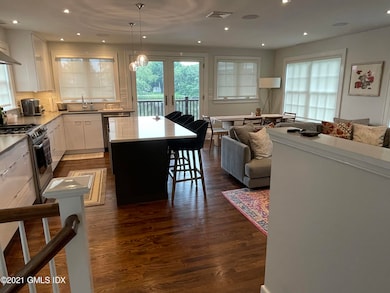
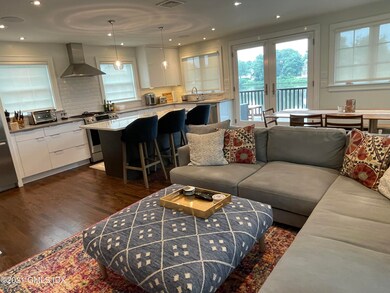
Completely renovated Tudor Style 3 Bedroom+Den, 3 Bathroom Single Family Home. Great Views, Close to downtown Cos Cob, Close to train, easy access to the highway. Direct Waterfront home featuring fabulous views over Mill Pond all year. This contemporary renovation boasts a new kitchen, stainless steel appliances throughout, a private laundry room, walk-in closet in the Master Suite a private den with gas fireplace, Open floorplan with covered patio.
Home Details
Home Type
- Single Family
Est. Annual Taxes
- $8,793
Year Built
- Built in 1937 | Remodeled in 2018
Lot Details
- Home fronts a pond
- Level Lot
Parking
- 1 Car Attached Garage
- Off-Street Parking
Home Design
- Tudor Architecture
- Slate Roof
- Stucco
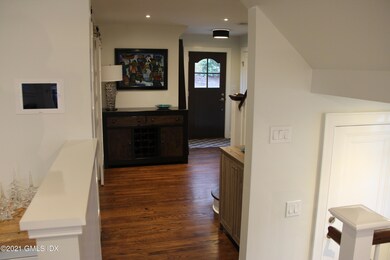
Interior Spaces
- 2,139 Sq Ft Home
- 1 Fireplace
- Pocket Doors
- Entrance Foyer
- Combination Kitchen and Dining Room
- Partially Finished Basement
- Partial Basement
- Pull Down Stairs to Attic
- Eat-In Kitchen
Bedrooms and Bathrooms
- 3 Bedrooms
- Walk-In Closet
Laundry
- Laundry Room
- Washer and Dryer
Utilities
- Forced Air Heating and Cooling System
- Heating System Uses Gas
- Heating System Uses Natural Gas
- Gas Water Heater
- Prewired Cat-5 Cables
Community Details
- No Pets Allowed
Listing and Financial Details
- 12 Month Lease Term
- Long Term Lease
- Assessor Parcel Number 08-2102/S
Map
Source: Greenwich Association of REALTORS®
MLS Number: 123929
APN: GREE-000008-000000-002102-S000000
Disclaimer: Certain information contained herein is derived from information provided by parties other than Homes.com. All information provided is deemed reliable, but is not guaranteed to be accurate and should be independently verified.
![]() Listing data courtesy of Greenwich MLS. IDX information is provided exclusively for consumers’ personal, non-commercial use, that it may not be used for any purpose other than to
Listing data courtesy of Greenwich MLS. IDX information is provided exclusively for consumers’ personal, non-commercial use, that it may not be used for any purpose other than to
identify prospective properties consumers may be interested in purchasing. Data is deemed reliable but is not guaranteed accurate by the MLS.
- 7 River Rd Unit Boat Slip A-2
- 7 River Rd Unit Boat Slip D-14
- 15 River Rd Unit 210
- 42 Mead Ave
- 3 Relay Ct
- 11 Valleywood Rd
- 37 Miltiades Ave
- 7 Stanwich Rd
- 4 Sound Shore Dr Unit 24
- 24 Valley Rd
- 41 Valley Rd
- 47 Valley Rd Unit B3
- 76 Sinawoy Rd
- 6 Gilliam Ln
- 32 Meyer Place
- 48 Meyer Place
- 3 Finney Knoll Ln
- 67 Cos Cob Ave
- 7 Jones Park Dr
- 203 Riverside Ave
- 15 River Rd Unit 220
- 85 Strickland Rd Unit 2
- 100 E Putnam Ave Unit 206
- 100 E Putnam Ave Unit 305
- 100 E Putnam Ave Unit 211
- 100 E Putnam Ave
- 84 E Putnam Ave
- 4 Orchard St Unit O
- 19 Bayside Terrace
- 53 Indian Field Rd
- 453 E Putnam Ave Unit 4H
- 428 E Putnam Ave Unit 2
- 434 E Putnam Ave Unit 2L
- 11 Stanwich Rd
- 25 Buxton Ln
- 12 Tremont St
- 90 Riverside Ave Unit 5
- 519 E Putnam Ave
- 63 Riverside Ave
- 84 Indian Field Rd
