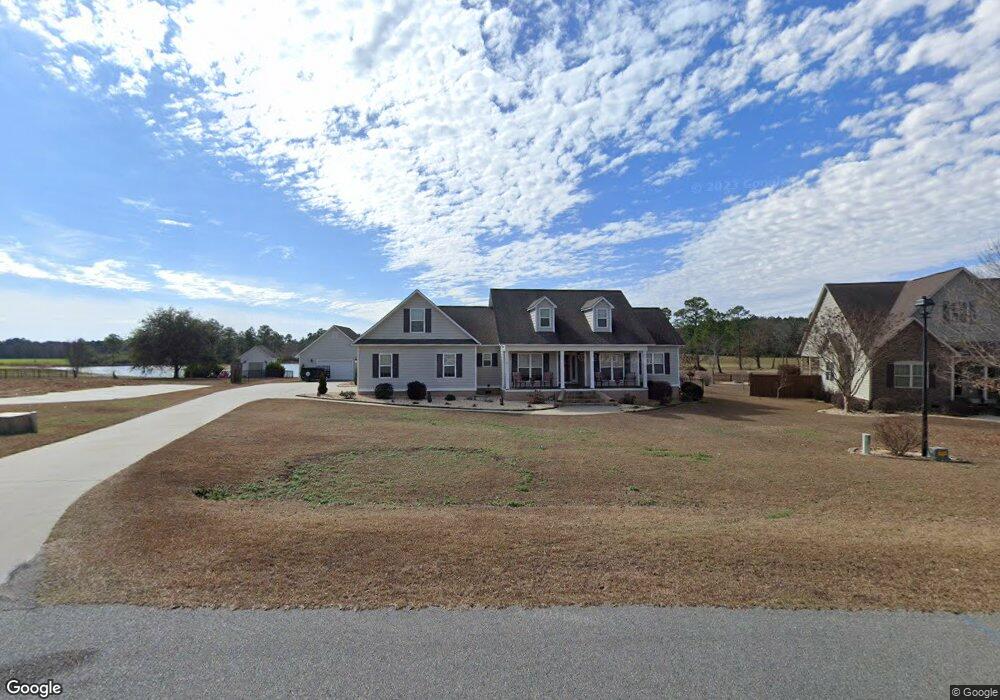
40 Surrey Cir Unit 30 Tifton, GA 31793
Estimated Value: $402,000 - $424,000
3
Beds
5
Baths
2,486
Sq Ft
$165/Sq Ft
Est. Value
About This Home
This home is located at 40 Surrey Cir Unit 30, Tifton, GA 31793 and is currently estimated at $411,115, approximately $165 per square foot. 40 Surrey Cir Unit 30 is a home located in Tift County with nearby schools including J.T. Reddick School, Matt Wilson Elementary School, and Annie Belle Clark Primary School.
Ownership History
Date
Name
Owned For
Owner Type
Purchase Details
Closed on
Apr 18, 2025
Sold by
Pate Wendy
Bought by
Roberts Amanda and Roberts Jeffrey
Current Estimated Value
Home Financials for this Owner
Home Financials are based on the most recent Mortgage that was taken out on this home.
Original Mortgage
$1,166
Outstanding Balance
$1,161
Interest Rate
6.67%
Mortgage Type
New Conventional
Estimated Equity
$409,954
Purchase Details
Closed on
Jan 12, 2011
Sold by
Pate Henry B
Bought by
Pate Wendy
Purchase Details
Closed on
Nov 21, 2007
Sold by
Bid Creek Development Llc
Bought by
Pate Henry B and Pate Wendy M
Home Financials for this Owner
Home Financials are based on the most recent Mortgage that was taken out on this home.
Original Mortgage
$259,200
Interest Rate
6.29%
Mortgage Type
New Conventional
Create a Home Valuation Report for This Property
The Home Valuation Report is an in-depth analysis detailing your home's value as well as a comparison with similar homes in the area
Home Values in the Area
Average Home Value in this Area
Purchase History
| Date | Buyer | Sale Price | Title Company |
|---|---|---|---|
| Roberts Amanda | $408,500 | -- | |
| Pate Wendy | -- | -- | |
| Pate Henry B | $259,200 | -- |
Source: Public Records
Mortgage History
| Date | Status | Borrower | Loan Amount |
|---|---|---|---|
| Open | Roberts Amanda | $1,166 | |
| Previous Owner | Pate Henry B | $259,200 |
Source: Public Records
Tax History Compared to Growth
Tax History
| Year | Tax Paid | Tax Assessment Tax Assessment Total Assessment is a certain percentage of the fair market value that is determined by local assessors to be the total taxable value of land and additions on the property. | Land | Improvement |
|---|---|---|---|---|
| 2024 | $3,388 | $153,756 | $24,000 | $129,756 |
| 2023 | $3,598 | $118,315 | $10,800 | $107,515 |
| 2022 | $3,525 | $118,315 | $10,800 | $107,515 |
| 2021 | $3,545 | $118,315 | $10,800 | $107,515 |
| 2020 | $2,964 | $97,008 | $10,800 | $86,208 |
| 2019 | $2,958 | $97,008 | $10,800 | $86,208 |
| 2018 | $2,953 | $97,008 | $10,800 | $86,208 |
| 2017 | $2,971 | $97,008 | $10,800 | $86,208 |
| 2016 | $2,974 | $97,008 | $10,800 | $86,208 |
| 2015 | $2,975 | $97,008 | $10,800 | $86,208 |
| 2014 | $2,982 | $97,008 | $10,800 | $86,208 |
| 2013 | -- | $97,008 | $10,800 | $86,208 |
Source: Public Records
Map
Nearby Homes
- 45 Surrey Cir
- 33 Surrey Cir
- 27 Water's Edge Way
- 17 Waters Edge Way
- 0 Jordan Rd
- 0 Union Industrial Way
- 4716 Union Rd
- 54 Jacks Way
- 4480 Union Rd
- 1802 Golden Rd W
- 0 Union Rd
- 604 Golden Rd W
- 4502 Carpenter Rd S
- 4104 London Ln
- 4554 Carpenter Rd S
- 0 Deer Run Cir
- 64 Palmetta Rd
- 100 Palmetta Rd
- 2906 S Park Ave
- 2729 Central Ave S