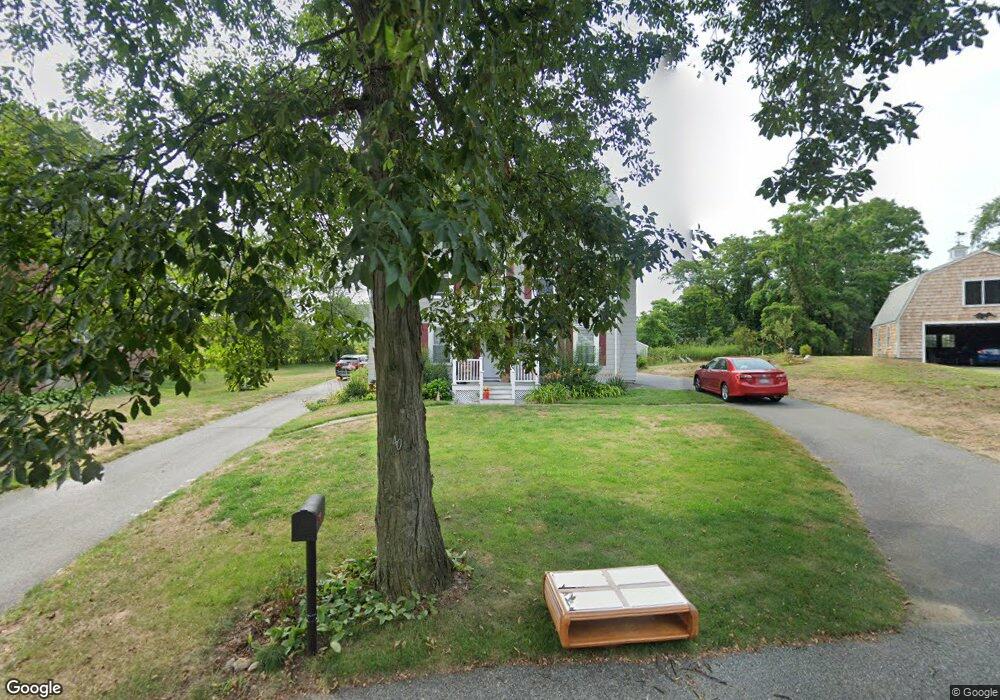
40 Trask St Beverly, MA 01915
North Beverly NeighborhoodEstimated Value: $800,000 - $899,000
5
Beds
3
Baths
2,830
Sq Ft
$299/Sq Ft
Est. Value
About This Home
This home is located at 40 Trask St, Beverly, MA 01915 and is currently estimated at $846,975, approximately $299 per square foot. 40 Trask St is a home located in Essex County with nearby schools including Beverly High School, Waldorf School at Moraine Farm, and North Shore Christian School.
Ownership History
Date
Name
Owned For
Owner Type
Purchase Details
Closed on
Jun 13, 2018
Sold by
Vasile Rt and Vasile
Bought by
Vasile Theresa R
Current Estimated Value
Home Financials for this Owner
Home Financials are based on the most recent Mortgage that was taken out on this home.
Original Mortgage
$365,000
Outstanding Balance
$312,986
Interest Rate
4.5%
Mortgage Type
New Conventional
Estimated Equity
$533,989
Purchase Details
Closed on
Jun 6, 2011
Sold by
Vasile Thomas and Vasile Judith A
Bought by
Vasile Rt and Vasile
Purchase Details
Closed on
Apr 29, 2011
Sold by
Vasile Thomas and Vasile Judith A
Bought by
Vasile Rt and Vasile
Create a Home Valuation Report for This Property
The Home Valuation Report is an in-depth analysis detailing your home's value as well as a comparison with similar homes in the area
Home Values in the Area
Average Home Value in this Area
Purchase History
| Date | Buyer | Sale Price | Title Company |
|---|---|---|---|
| Vasile Theresa R | $456,500 | -- | |
| Vasile Rt | -- | -- | |
| Vasile Rt | -- | -- |
Source: Public Records
Mortgage History
| Date | Status | Borrower | Loan Amount |
|---|---|---|---|
| Open | Vasile Theresa R | $365,000 | |
| Previous Owner | Vasile Rt | $20,000 | |
| Previous Owner | Vasile Rt | $100,000 |
Source: Public Records
Tax History
| Year | Tax Paid | Tax Assessment Tax Assessment Total Assessment is a certain percentage of the fair market value that is determined by local assessors to be the total taxable value of land and additions on the property. | Land | Improvement |
|---|---|---|---|---|
| 2025 | $7,767 | $706,700 | $346,400 | $360,300 |
| 2024 | $7,538 | $671,200 | $310,900 | $360,300 |
| 2023 | $6,931 | $615,500 | $273,600 | $341,900 |
| 2022 | $7,079 | $581,700 | $239,800 | $341,900 |
| 2021 | $6,631 | $522,100 | $211,400 | $310,700 |
| 2020 | $6,732 | $524,700 | $219,100 | $305,600 |
| 2019 | $6,308 | $477,500 | $201,300 | $276,200 |
| 2018 | $5,802 | $426,600 | $184,000 | $242,600 |
| 2017 | $5,828 | $408,100 | $158,300 | $249,800 |
| 2016 | $5,166 | $359,000 | $138,500 | $220,500 |
| 2015 | $5,065 | $359,000 | $138,500 | $220,500 |
Source: Public Records
Map
Nearby Homes
Your Personal Tour Guide
Ask me questions while you tour the home.