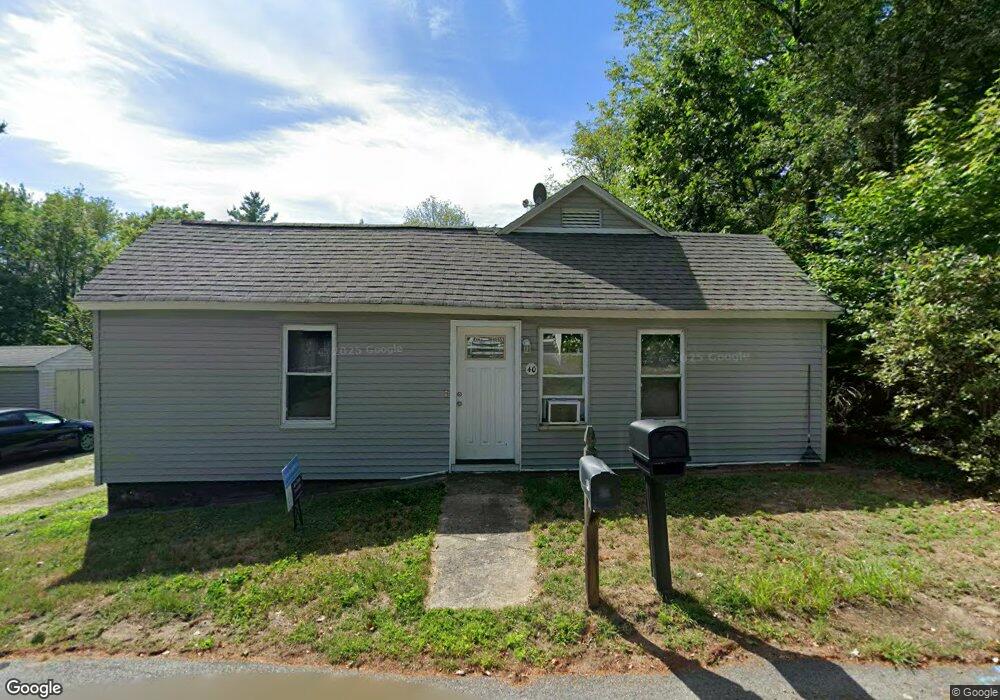
40 Tucker St Winchendon, MA 01475
Estimated Value: $231,000 - $300,000
2
Beds
1
Bath
1,020
Sq Ft
$268/Sq Ft
Est. Value
About This Home
This home is located at 40 Tucker St, Winchendon, MA 01475 and is currently estimated at $273,280, approximately $267 per square foot. 40 Tucker St is a home located in Worcester County with nearby schools including Memorial, Toy Town Elementary School, and The Winchendon School.
Ownership History
Date
Name
Owned For
Owner Type
Purchase Details
Closed on
Mar 3, 2025
Sold by
Wilson Brenda M
Bought by
Wilson Deric
Current Estimated Value
Home Financials for this Owner
Home Financials are based on the most recent Mortgage that was taken out on this home.
Original Mortgage
$50,000
Outstanding Balance
$49,668
Interest Rate
7.04%
Mortgage Type
Purchase Money Mortgage
Estimated Equity
$223,612
Purchase Details
Closed on
Nov 3, 1993
Sold by
Colonial Coop Bank
Bought by
Mable Robert and Mable Debra
Home Financials for this Owner
Home Financials are based on the most recent Mortgage that was taken out on this home.
Original Mortgage
$35,000
Interest Rate
6.83%
Mortgage Type
Purchase Money Mortgage
Create a Home Valuation Report for This Property
The Home Valuation Report is an in-depth analysis detailing your home's value as well as a comparison with similar homes in the area
Home Values in the Area
Average Home Value in this Area
Purchase History
| Date | Buyer | Sale Price | Title Company |
|---|---|---|---|
| Wilson Deric | $299,000 | None Available | |
| Wilson Deric | $299,000 | None Available | |
| Mable Robert | $35,000 | -- | |
| Mable Robert | $35,000 | -- |
Source: Public Records
Mortgage History
| Date | Status | Borrower | Loan Amount |
|---|---|---|---|
| Open | Wilson Deric | $50,000 | |
| Closed | Wilson Deric | $50,000 | |
| Previous Owner | Mable Robert | $5,924 | |
| Previous Owner | Mable Robert | $35,000 |
Source: Public Records
Tax History Compared to Growth
Tax History
| Year | Tax Paid | Tax Assessment Tax Assessment Total Assessment is a certain percentage of the fair market value that is determined by local assessors to be the total taxable value of land and additions on the property. | Land | Improvement |
|---|---|---|---|---|
| 2025 | $1,741 | $148,200 | $40,100 | $108,100 |
| 2024 | $1,677 | $133,700 | $36,400 | $97,300 |
| 2023 | $1,742 | $130,000 | $34,600 | $95,400 |
| 2022 | $1,924 | $127,300 | $44,400 | $82,900 |
| 2021 | $1,742 | $110,800 | $39,000 | $71,800 |
| 2020 | $1,708 | $104,900 | $37,200 | $67,700 |
| 2019 | $1,621 | $97,000 | $34,600 | $62,400 |
| 2018 | $1,535 | $88,500 | $32,100 | $56,400 |
| 2017 | $1,472 | $81,900 | $33,600 | $48,300 |
| 2016 | $1,431 | $82,100 | $32,000 | $50,100 |
| 2015 | $1,373 | $82,100 | $32,000 | $50,100 |
| 2014 | $1,344 | $84,200 | $34,600 | $49,600 |
Source: Public Records
Map
Nearby Homes
- Lot C Tucker St
- Lot B Tucker St
- Lot A Tucker St
- 5A4-10 Tucker St
- 53 Tucker St
- 58 Tucker St
- 37 Tucker St
- 30 Tucker St
- 129 Woodlawn St
- 177 Goodrich St
- 119 Woodlawn St
- 171 Goodrich St
- 61 Tucker St
- 125 Woodlawn St
- 139 Woodlawn St
- 109 Woodlawn St
- 149 Woodlawn St
- 18 Eastern Ave
- 18 Eastern Ave Unit 1
- 3 Tucker St