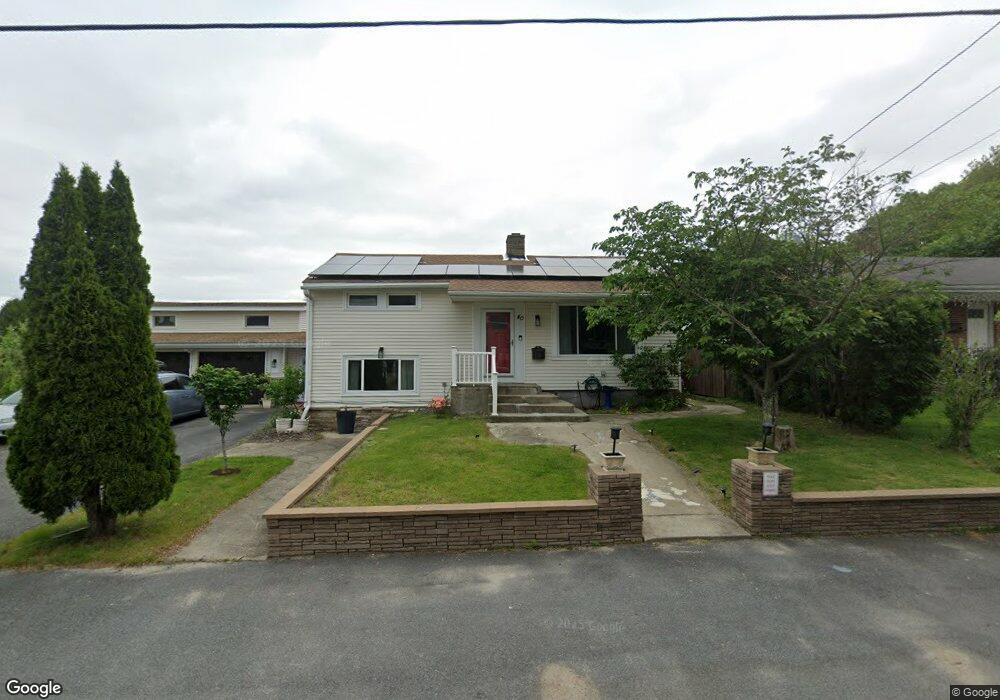
40 Union Ave Johnston, RI 02919
Hartford Avenue NeighborhoodEstimated Value: $442,000 - $512,000
3
Beds
2
Baths
2,430
Sq Ft
$198/Sq Ft
Est. Value
About This Home
This home is located at 40 Union Ave, Johnston, RI 02919 and is currently estimated at $480,786, approximately $197 per square foot. 40 Union Ave is a home located in Providence County with nearby schools including Johnston Senior High School and Mount Pleasant Academy.
Ownership History
Date
Name
Owned For
Owner Type
Purchase Details
Closed on
Feb 8, 2011
Sold by
Aragao Jason
Bought by
Bouthavong Lucky
Current Estimated Value
Purchase Details
Closed on
Jul 2, 2009
Sold by
Aurora Loan Services L
Bought by
Bouthavong Lucky
Home Financials for this Owner
Home Financials are based on the most recent Mortgage that was taken out on this home.
Original Mortgage
$178,690
Interest Rate
4.86%
Mortgage Type
Purchase Money Mortgage
Purchase Details
Closed on
Mar 2, 2009
Sold by
Maluk Eric
Bought by
Gn Mortgage Llc
Purchase Details
Closed on
Mar 29, 2007
Sold by
Aragao Jason
Bought by
Maluk Eric
Purchase Details
Closed on
Feb 28, 2007
Sold by
Tantimonico Ann
Bought by
Aragao Jason
Create a Home Valuation Report for This Property
The Home Valuation Report is an in-depth analysis detailing your home's value as well as a comparison with similar homes in the area
Home Values in the Area
Average Home Value in this Area
Purchase History
| Date | Buyer | Sale Price | Title Company |
|---|---|---|---|
| Bouthavong Lucky | -- | -- | |
| Bouthavong Lucky | $147,000 | -- | |
| Gn Mortgage Llc | $269,000 | -- | |
| Maluk Eric | $269,000 | -- | |
| Aragao Jason | $200,500 | -- | |
| Bouthavong Lucky | -- | -- | |
| Bouthavong Lucky | $147,000 | -- | |
| Gn Mortgage Llc | $269,000 | -- | |
| Maluk Eric | $269,000 | -- | |
| Aragao Jason | $200,500 | -- |
Source: Public Records
Mortgage History
| Date | Status | Borrower | Loan Amount |
|---|---|---|---|
| Previous Owner | Aragao Jason | $163,000 | |
| Previous Owner | Aragao Jason | $178,690 |
Source: Public Records
Tax History Compared to Growth
Tax History
| Year | Tax Paid | Tax Assessment Tax Assessment Total Assessment is a certain percentage of the fair market value that is determined by local assessors to be the total taxable value of land and additions on the property. | Land | Improvement |
|---|---|---|---|---|
| 2025 | $6,029 | $386,000 | $93,200 | $292,800 |
| 2024 | $5,906 | $386,000 | $93,200 | $292,800 |
| 2023 | $5,906 | $386,000 | $93,200 | $292,800 |
| 2022 | $4,624 | $248,700 | $71,500 | $177,200 |
| 2021 | $5,780 | $248,700 | $71,500 | $177,200 |
| 2018 | $5,996 | $218,100 | $56,200 | $161,900 |
| 2016 | $7,932 | $218,100 | $56,200 | $161,900 |
| 2015 | $5,604 | $193,300 | $58,800 | $134,500 |
| 2014 | $4,446 | $192,100 | $58,800 | $133,300 |
| 2013 | $5,557 | $193,300 | $58,800 | $134,500 |
Source: Public Records
Map
Nearby Homes
- 50 Rosemont Ave
- 32 Waterman Ave
- 25 Woodcrest Dr
- 18 Lyman Ave
- 35 Auburn Ave
- 46 Auburn Ave
- 0 Eagle St
- 25 George Waterman Rd
- 71 Waveland St
- 0 Jackson Ave
- 103 Springfield Ave
- 5 Olivia Ct
- 338 Cherry Hill Rd
- 5 Katherine Dr
- 5 Pezzi St
- 6 Flanders St
- 1145 Hartford Ave Unit 5B
- 4 Barbato Dr
- 6 Day St
- 136 George Waterman Rd