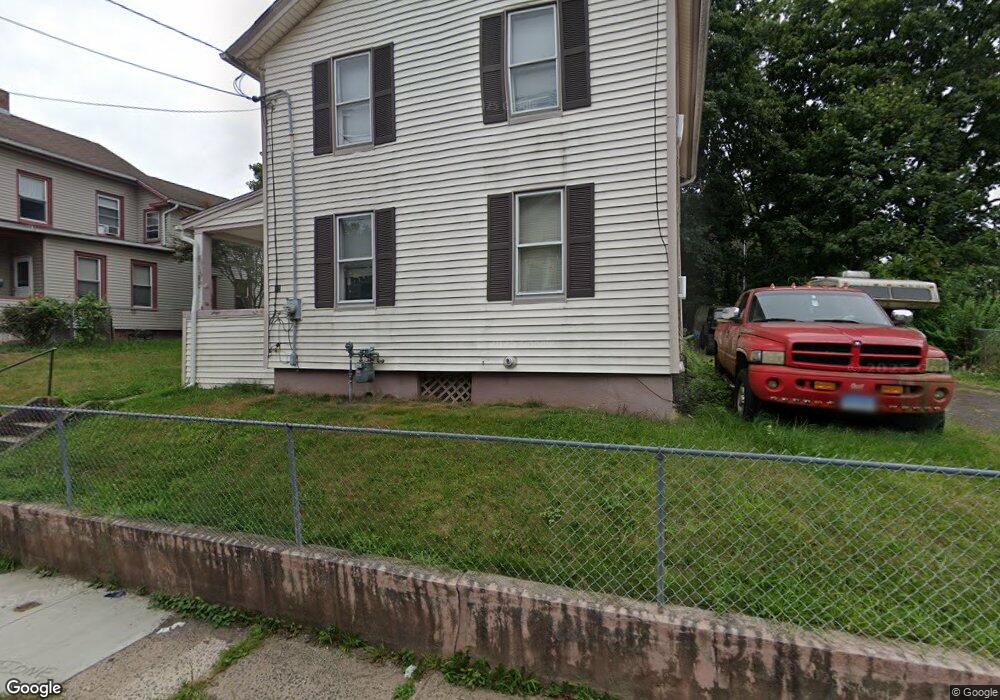
40 Union St Meriden, CT 06451
Estimated Value: $231,000 - $260,000
2
Beds
2
Baths
1,340
Sq Ft
$183/Sq Ft
Est. Value
About This Home
This home is located at 40 Union St, Meriden, CT 06451 and is currently estimated at $245,663, approximately $183 per square foot. 40 Union St is a home located in New Haven County with nearby schools including John Barry School, Lincoln Middle School, and Orville H. Platt High School.
Ownership History
Date
Name
Owned For
Owner Type
Purchase Details
Closed on
Dec 22, 1995
Sold by
Donnelly Donald E
Bought by
Ramos Carlos R and Ramos Lucrecia C
Current Estimated Value
Home Financials for this Owner
Home Financials are based on the most recent Mortgage that was taken out on this home.
Original Mortgage
$61,200
Interest Rate
7.33%
Purchase Details
Closed on
Mar 17, 1989
Sold by
Eckhouse Tr Steven
Bought by
Ayala Walter R
Create a Home Valuation Report for This Property
The Home Valuation Report is an in-depth analysis detailing your home's value as well as a comparison with similar homes in the area
Home Values in the Area
Average Home Value in this Area
Purchase History
| Date | Buyer | Sale Price | Title Company |
|---|---|---|---|
| Ramos Carlos R | $62,500 | -- | |
| Ayala Walter R | $93,500 | -- |
Source: Public Records
Mortgage History
| Date | Status | Borrower | Loan Amount |
|---|---|---|---|
| Open | Ayala Walter R | $103,900 | |
| Closed | Ayala Walter R | $61,200 | |
| Closed | Ayala Walter R | $1,795 |
Source: Public Records
Tax History
| Year | Tax Paid | Tax Assessment Tax Assessment Total Assessment is a certain percentage of the fair market value that is determined by local assessors to be the total taxable value of land and additions on the property. | Land | Improvement |
|---|---|---|---|---|
| 2025 | $3,691 | $97,370 | $25,340 | $72,030 |
| 2024 | $3,750 | $97,370 | $25,340 | $72,030 |
| 2023 | $3,614 | $97,370 | $25,340 | $72,030 |
| 2022 | $3,410 | $97,370 | $25,340 | $72,030 |
| 2021 | $2,892 | $66,430 | $21,280 | $45,150 |
| 2020 | $2,884 | $66,430 | $21,280 | $45,150 |
| 2019 | $2,859 | $66,430 | $21,280 | $45,150 |
| 2018 | $2,870 | $66,430 | $21,280 | $45,150 |
| 2017 | $2,794 | $66,430 | $21,280 | $45,150 |
| 2016 | $3,186 | $82,180 | $23,870 | $58,310 |
| 2015 | $3,186 | $82,180 | $23,870 | $58,310 |
| 2014 | $3,109 | $82,180 | $23,870 | $58,310 |
Source: Public Records
Map
Nearby Homes
- 243 Grove St
- 49 Prospect St
- 201 Colony St
- 33 W Main St Unit 11
- 33 W Main St Unit 16
- 33 W Main St Unit 17
- 33 W Main St Unit 1
- 171 Foster St
- 14 North St
- 55 Lewis Ave
- 25 Catlin St
- 200 W Main St
- 185 Springdale Ave
- 250 Pratt St
- 230 W Main St
- 61 Randolph Ave
- 74 Randolph Ave
- 236 W Main St
- 80 Willow St
- 23 N 1st St
Your Personal Tour Guide
Ask me questions while you tour the home.