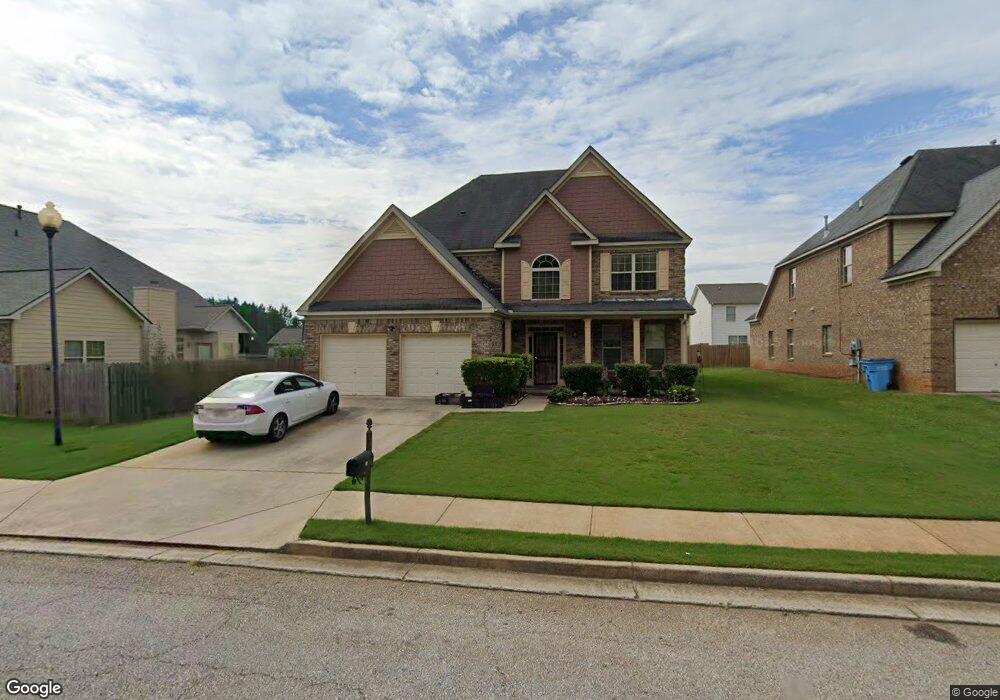
40 Vermillion Way Covington, GA 30016
Estimated Value: $320,000 - $426,000
--
Bed
2
Baths
3,208
Sq Ft
$113/Sq Ft
Est. Value
About This Home
This home is located at 40 Vermillion Way, Covington, GA 30016 and is currently estimated at $363,068, approximately $113 per square foot. 40 Vermillion Way is a home located in Newton County with nearby schools including South Salem Elementary School, Liberty Middle School, and Newton High School.
Ownership History
Date
Name
Owned For
Owner Type
Purchase Details
Closed on
Jan 27, 2024
Sold by
C & E Family Trust
Bought by
Jackson Evangeline and Jackson Evangeline E
Current Estimated Value
Purchase Details
Closed on
Jan 29, 2022
Sold by
Foster Carey
Bought by
C And E Family Tr
Purchase Details
Closed on
Nov 27, 2020
Sold by
Foster Carey
Bought by
Foster Carey and Foster Ebonita L
Purchase Details
Closed on
Sep 19, 2008
Sold by
Scenic Homes
Bought by
Foster Carey and Jackson Evangeline
Home Financials for this Owner
Home Financials are based on the most recent Mortgage that was taken out on this home.
Original Mortgage
$204,239
Interest Rate
6.49%
Mortgage Type
FHA
Create a Home Valuation Report for This Property
The Home Valuation Report is an in-depth analysis detailing your home's value as well as a comparison with similar homes in the area
Home Values in the Area
Average Home Value in this Area
Purchase History
| Date | Buyer | Sale Price | Title Company |
|---|---|---|---|
| Jackson Evangeline | $100 | -- | |
| C And E Family Tr | $100 | -- | |
| Foster Carey | -- | -- | |
| Foster Carey | $205,500 | -- |
Source: Public Records
Mortgage History
| Date | Status | Borrower | Loan Amount |
|---|---|---|---|
| Previous Owner | Foster Carey | $204,239 |
Source: Public Records
Tax History Compared to Growth
Tax History
| Year | Tax Paid | Tax Assessment Tax Assessment Total Assessment is a certain percentage of the fair market value that is determined by local assessors to be the total taxable value of land and additions on the property. | Land | Improvement |
|---|---|---|---|---|
| 2024 | $2,550 | $101,480 | $17,600 | $83,880 |
| 2023 | $2,585 | $96,280 | $11,200 | $85,080 |
| 2022 | $2,349 | $87,600 | $11,200 | $76,400 |
| 2021 | $2,650 | $88,720 | $11,200 | $77,520 |
| 2020 | $2,302 | $70,160 | $8,000 | $62,160 |
| 2019 | $2,318 | $69,640 | $8,000 | $61,640 |
| 2018 | $2,379 | $71,000 | $8,000 | $63,000 |
| 2017 | $2,515 | $74,960 | $7,200 | $67,760 |
| 2016 | $2,629 | $78,280 | $9,000 | $69,280 |
| 2015 | $2,206 | $65,960 | $4,800 | $61,160 |
| 2014 | $1,706 | $51,520 | $0 | $0 |
Source: Public Records
Map
Nearby Homes
- 30 Vermillion Way
- 110 Halibut Cir
- 255 Skipjack Ct
- 65 Mary Jane Ln
- 65 Wisteria Blvd
- 25 Mary Jane Ln
- 15 Regal Ln
- 40 Willow Tree Terrace
- 160 Wisteria Blvd
- 95 Forray Dr
- 45 Chapman Way
- 95 Willow Tree Terrace
- 230 Shiver Blvd
- 215 Wisteria Way
- 4681 Salem Rd
- 235 Saint Anne's Place
- 218 Saint Anne's Place
- 419993 St Annes Place
- 50 Amberjack Trail
- 0 Amberjack Trail Unit 8914083
- 0 Amberjack Trail
- 45 Alyssa Ln
- 0 Vermillion Way Unit 8928097
- 35 Alyssa Ln
- 50 Vermillion Way
- 70 Amberjack Trail
- 70 Amberjack Trail Unit 58
- 35 Vermillion Way Unit 70
- 75 Halibut Cir
- 25 Vermillion Way
- 85 Halibut Cir
- 55 Amberjack Trail
- 95 Halibut Cir Unit 62
- 95 Halibut Cir Unit 1
- 95 Halibut Cir
- 65 Amberjack Trail Unit LOT 77
- 65 Amberjack Trail
- 15 Vermillion Way