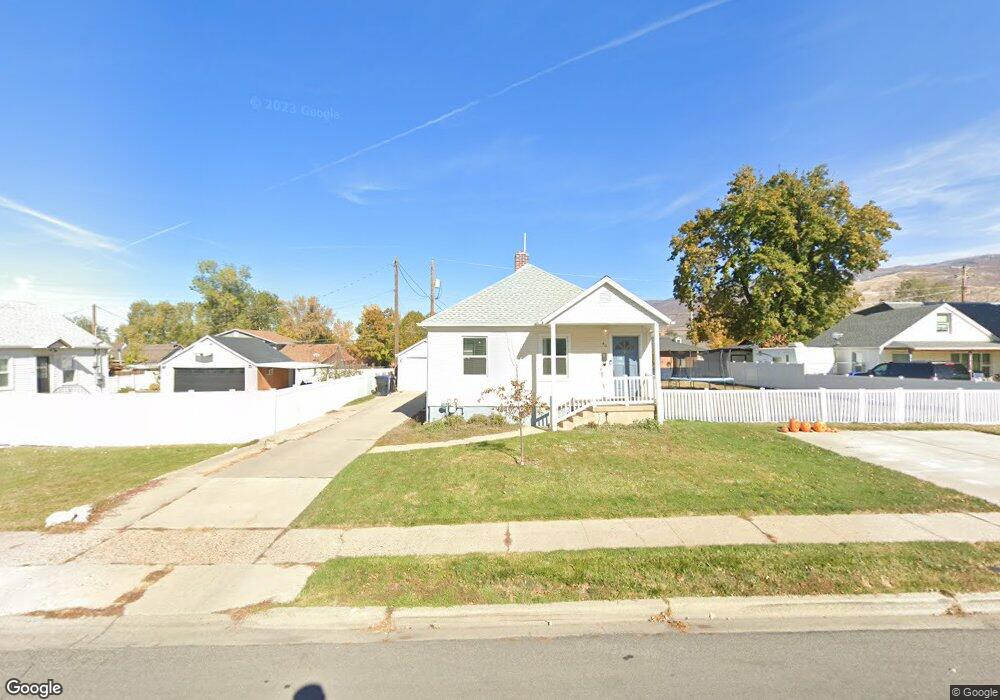
40 W 1200 S Bountiful, UT 84010
Estimated Value: $468,000 - $551,000
3
Beds
2
Baths
1,824
Sq Ft
$271/Sq Ft
Est. Value
About This Home
This home is located at 40 W 1200 S, Bountiful, UT 84010 and is currently estimated at $495,039, approximately $271 per square foot. 40 W 1200 S is a home located in Davis County with nearby schools including Bountiful Elementary School, Millcreek Junior High School, and Bountiful High School.
Ownership History
Date
Name
Owned For
Owner Type
Purchase Details
Closed on
Sep 6, 2023
Sold by
Outsen Max L and Outsen Stephanie R
Bought by
Outsen Family Trust and Outsen
Current Estimated Value
Purchase Details
Closed on
Mar 7, 2017
Sold by
Bird Scott L
Bought by
Outsen Max L and Outsen Stephanie R
Home Financials for this Owner
Home Financials are based on the most recent Mortgage that was taken out on this home.
Original Mortgage
$227,950
Interest Rate
4.17%
Mortgage Type
New Conventional
Purchase Details
Closed on
Mar 29, 2005
Sold by
Crawford Jerry M and Crawford Beverly A
Bought by
Bird Scott L
Home Financials for this Owner
Home Financials are based on the most recent Mortgage that was taken out on this home.
Original Mortgage
$23,600
Interest Rate
5.77%
Mortgage Type
Credit Line Revolving
Create a Home Valuation Report for This Property
The Home Valuation Report is an in-depth analysis detailing your home's value as well as a comparison with similar homes in the area
Purchase History
| Date | Buyer | Sale Price | Title Company |
|---|---|---|---|
| Outsen Family Trust | -- | None Listed On Document | |
| Outsen Max L | -- | Mountain View Title | |
| Bird Scott L | -- | None Available |
Source: Public Records
Mortgage History
| Date | Status | Borrower | Loan Amount |
|---|---|---|---|
| Previous Owner | Outsen Max L | $227,950 | |
| Previous Owner | Bird Scott L | $23,600 | |
| Previous Owner | Bird Scott L | $23,600 |
Source: Public Records
Tax History
| Year | Tax Paid | Tax Assessment Tax Assessment Total Assessment is a certain percentage of the fair market value that is determined by local assessors to be the total taxable value of land and additions on the property. | Land | Improvement |
|---|---|---|---|---|
| 2025 | -- | $241,450 | $140,770 | $100,680 |
| 2024 | -- | $234,300 | $128,402 | $105,898 |
| 2023 | $2,263 | $377,000 | $233,811 | $143,189 |
| 2022 | $2,360 | $216,150 | $127,027 | $89,123 |
| 2021 | $2,160 | $303,000 | $166,347 | $136,653 |
| 2020 | $1,911 | $268,000 | $141,105 | $126,895 |
| 2019 | $1,860 | $254,000 | $142,442 | $111,558 |
| 2018 | $1,725 | $231,000 | $139,480 | $91,520 |
| 2016 | $1,605 | $108,350 | $59,798 | $48,552 |
| 2015 | $1,493 | $98,120 | $59,798 | $38,322 |
| 2014 | $1,612 | $110,690 | $59,798 | $50,892 |
| 2013 | -- | $89,671 | $43,945 | $45,726 |
Source: Public Records
Map
Nearby Homes
Your Personal Tour Guide
Ask me questions while you tour the home.