Estimated Value: $294,000 - $310,000
4
Beds
2
Baths
1,560
Sq Ft
$192/Sq Ft
Est. Value
About This Home
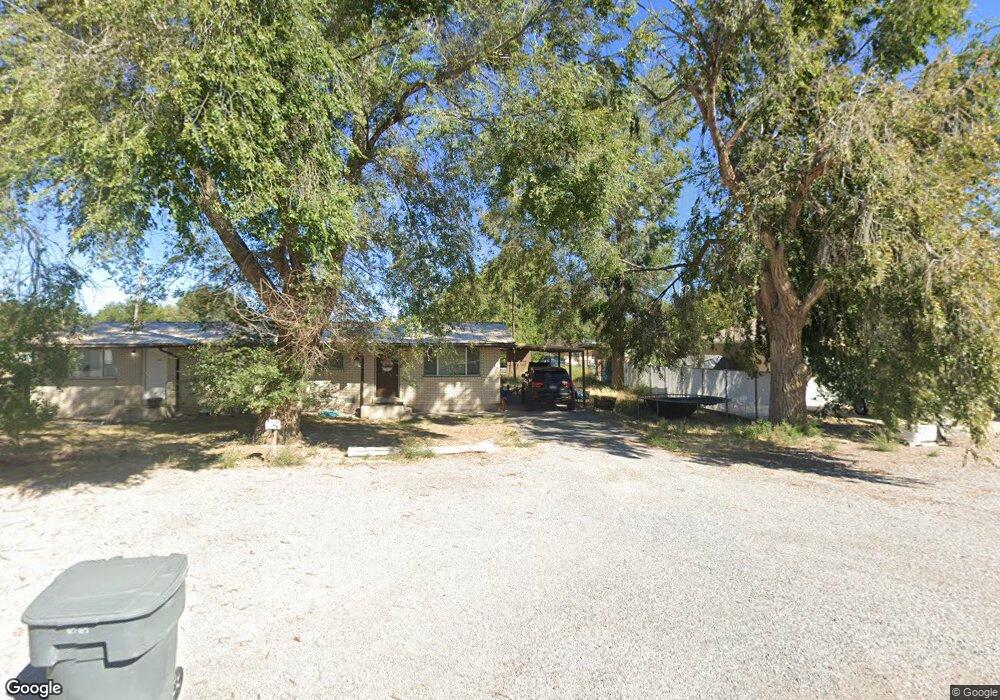
This home is located at 40 W 200 N Unit 40 ,44, Delta, UT 84624 and is currently estimated at $299,333, approximately $191 per square foot. 40 W 200 N Unit 40 ,44 is a home located in Millard County with nearby schools including Cba Center and White River Academy.
Ownership History
Date
Name
Owned For
Owner Type
Purchase Details
Closed on
Oct 9, 2019
Sold by
Stanton Lloyd Joseph and Stanton Tamara Lynne
Bought by
Bradyslist Llc
Current Estimated Value
Home Financials for this Owner
Home Financials are based on the most recent Mortgage that was taken out on this home.
Original Mortgage
$286,000
Outstanding Balance
$249,442
Interest Rate
3.5%
Mortgage Type
Commercial
Estimated Equity
$49,891
Purchase Details
Closed on
Sep 12, 2018
Sold by
Paris Sarah
Bought by
Stanton Lloyd Joseph and Stanton Tamara Lynne
Create a Home Valuation Report for This Property
The Home Valuation Report is an in-depth analysis detailing your home's value as well as a comparison with similar homes in the area
Home Values in the Area
Average Home Value in this Area
Purchase History
| Date | Buyer | Sale Price | Title Company |
|---|---|---|---|
| Bradyslist Llc | -- | Highland Title | |
| Stanton Lloyd Joseph | -- | None Available | |
| Paris Sarah | -- | None Available |
Source: Public Records
Mortgage History
| Date | Status | Borrower | Loan Amount |
|---|---|---|---|
| Open | Bradyslist Llc | $286,000 |
Source: Public Records
Tax History Compared to Growth
Tax History
| Year | Tax Paid | Tax Assessment Tax Assessment Total Assessment is a certain percentage of the fair market value that is determined by local assessors to be the total taxable value of land and additions on the property. | Land | Improvement |
|---|---|---|---|---|
| 2025 | $1,454 | $155,408 | $16,044 | $139,364 |
| 2024 | $1,454 | $108,329 | $12,202 | $96,127 |
| 2023 | $1,209 | $108,329 | $12,202 | $96,127 |
| 2022 | $1,221 | $91,809 | $12,756 | $79,053 |
| 2021 | $823 | $59,053 | $9,645 | $49,408 |
| 2020 | $816 | $58,177 | $8,769 | $49,408 |
| 2019 | $806 | $57,528 | $8,120 | $49,408 |
| 2018 | $696 | $50,092 | $8,120 | $41,972 |
| 2017 | $719 | $49,855 | $7,883 | $41,972 |
| 2016 | $696 | $49,855 | $7,883 | $41,972 |
| 2015 | $696 | $49,855 | $7,883 | $41,972 |
| 2014 | -- | $40,021 | $7,883 | $32,138 |
| 2013 | -- | $40,021 | $7,883 | $32,138 |
Source: Public Records
Map
Nearby Homes