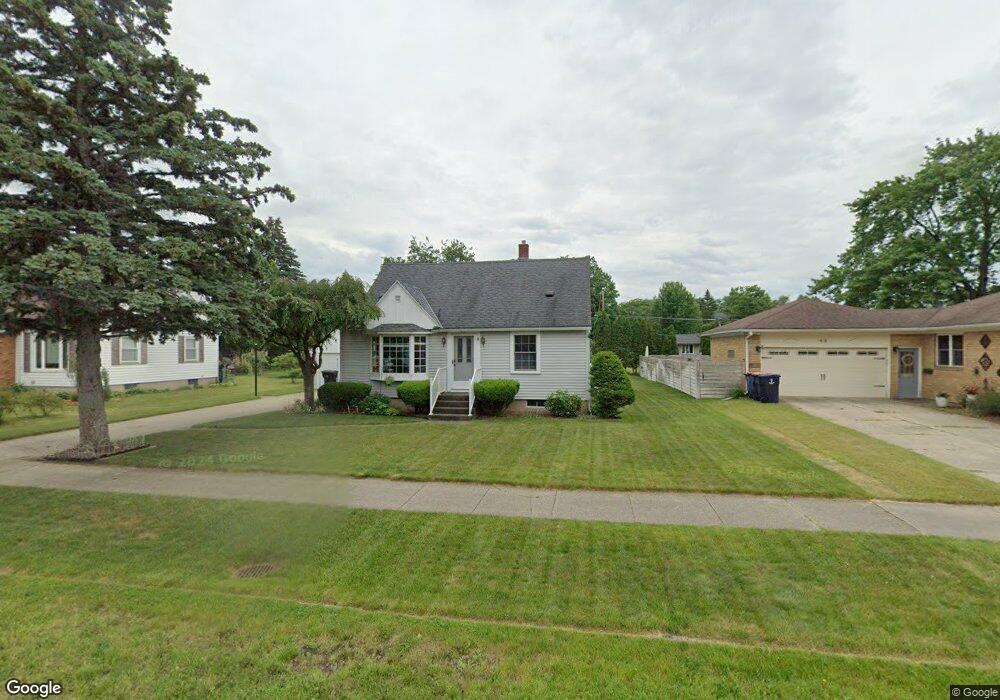
40 W 35th St Holland, MI 49423
Maplewood NeighborhoodEstimated Value: $330,145 - $372,000
4
Beds
3
Baths
1,800
Sq Ft
$196/Sq Ft
Est. Value
About This Home
This home is located at 40 W 35th St, Holland, MI 49423 and is currently estimated at $352,786, approximately $195 per square foot. 40 W 35th St is a home located in Allegan County with nearby schools including Maplewood, Jefferson Elementary School, and Holland High School.
Ownership History
Date
Name
Owned For
Owner Type
Purchase Details
Closed on
Aug 15, 2003
Sold by
Mulder James W and Mulder Nancy E
Bought by
Mulder James W and Mulder Nancy E
Current Estimated Value
Home Financials for this Owner
Home Financials are based on the most recent Mortgage that was taken out on this home.
Original Mortgage
$23,700
Interest Rate
6.18%
Mortgage Type
Purchase Money Mortgage
Purchase Details
Closed on
Mar 7, 2002
Sold by
Mulder James W and Mulder Nancy E
Bought by
Mulder James W and Mulder Nancy E
Purchase Details
Closed on
Aug 18, 1993
Sold by
Mulder James W
Create a Home Valuation Report for This Property
The Home Valuation Report is an in-depth analysis detailing your home's value as well as a comparison with similar homes in the area
Home Values in the Area
Average Home Value in this Area
Purchase History
| Date | Buyer | Sale Price | Title Company |
|---|---|---|---|
| Mulder James W | -- | Metropolitan Title Company | |
| Mulder James W | -- | Metropolitan Title Company | |
| Mulder James W | -- | -- | |
| -- | -- | -- | |
| -- | -- | -- |
Source: Public Records
Mortgage History
| Date | Status | Borrower | Loan Amount |
|---|---|---|---|
| Closed | Mulder James W | $23,700 |
Source: Public Records
Tax History
| Year | Tax Paid | Tax Assessment Tax Assessment Total Assessment is a certain percentage of the fair market value that is determined by local assessors to be the total taxable value of land and additions on the property. | Land | Improvement |
|---|---|---|---|---|
| 2025 | $2,435 | $138,900 | $31,600 | $107,300 |
| 2024 | -- | $115,100 | $27,900 | $87,200 |
| 2023 | $2,359 | $103,100 | $23,300 | $79,800 |
| 2022 | $2,162 | $94,500 | $22,300 | $72,200 |
| 2021 | $2,153 | $89,200 | $21,400 | $67,800 |
| 2020 | $2,061 | $77,000 | $17,100 | $59,900 |
| 2019 | $1,962 | $66,900 | $13,400 | $53,500 |
| 2018 | $1,962 | $64,200 | $13,400 | $50,800 |
| 2017 | $0 | $53,400 | $6,600 | $46,800 |
| 2016 | $0 | $53,400 | $6,600 | $46,800 |
| 2015 | -- | $53,400 | $6,600 | $46,800 |
| 2014 | -- | $45,700 | $6,600 | $39,100 |
| 2013 | -- | $43,000 | $6,600 | $36,400 |
Source: Public Records
Map
Nearby Homes
- 23 E 35th St
- 112 E 40th St
- 75 Old Mill Dr Unit 21
- 136 E 39th St
- 25 Trillium Ct Unit 6
- 199 E 34th St Unit 10
- 980 Lincoln Ave
- 317 Vista Green Dr
- 301 Vista Green Dr
- 814 York Ave
- Lot 15 Peppermint Dr
- Lot 16 Peppermint Dr
- Lot 17 of Peppermint Dr
- 975 Songbird Ln
- 188 E 26th St
- 28 E 23rd St
- 544 College Ave
- 536 College Ave
- 893 Harvest Dr Unit 51
- 875 Ottawa Ave