40 W 56th St New York, NY 10019
Midtown NeighborhoodEstimated Value: $9,625,292
--
Bed
--
Bath
10,500
Sq Ft
$917/Sq Ft
Est. Value
About This Home
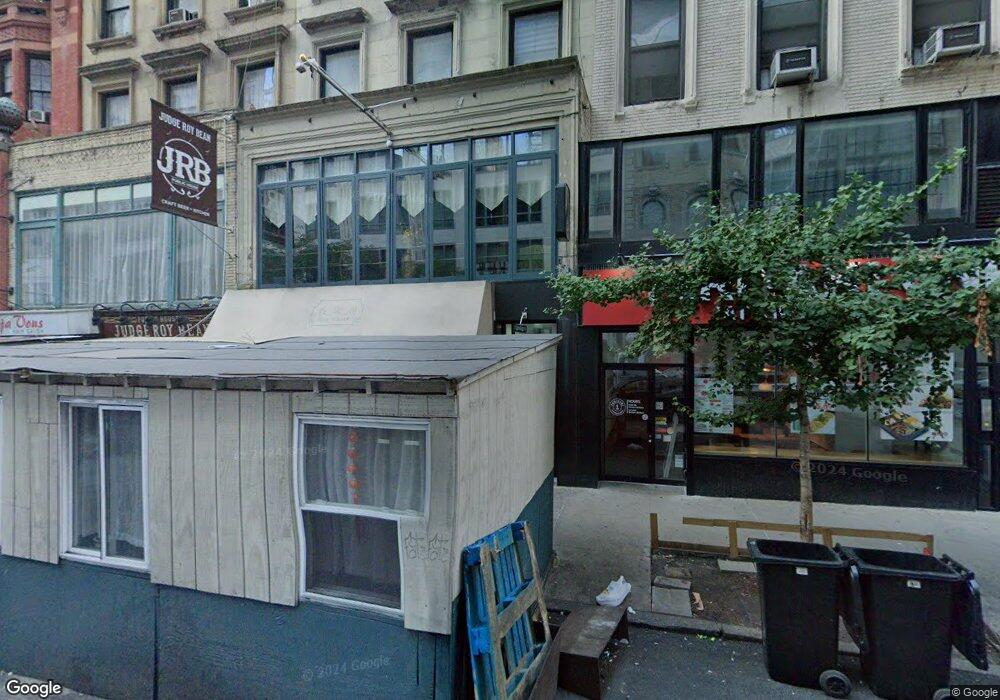
This home is located at 40 W 56th St, New York, NY 10019 and is currently estimated at $9,625,292, approximately $916 per square foot. 40 W 56th St is a home located in New York County with nearby schools including P.S. 111 Adolph S. Ochs, Clinton School, and Middle School 297.
Ownership History
Date
Name
Owned For
Owner Type
Purchase Details
Closed on
Apr 7, 2014
Sold by
Nrp 56 Llp
Bought by
Nr West 56Th Street Llc
Current Estimated Value
Home Financials for this Owner
Home Financials are based on the most recent Mortgage that was taken out on this home.
Original Mortgage
$6,000,000
Outstanding Balance
$4,547,338
Interest Rate
4.26%
Mortgage Type
Commercial
Estimated Equity
$4,847,318
Purchase Details
Closed on
Apr 5, 2007
Sold by
Fordec Realty Corp
Bought by
Nrp 56 Llc
Purchase Details
Closed on
Nov 1, 2002
Sold by
40 West 56 Llc
Bought by
Fordec Realty Corp
Home Financials for this Owner
Home Financials are based on the most recent Mortgage that was taken out on this home.
Original Mortgage
$2,200,000
Interest Rate
6.16%
Mortgage Type
Commercial
Purchase Details
Closed on
May 26, 1999
Sold by
40 West 56Th St Realty Co Llc
Bought by
40 West 56 Llc
Purchase Details
Closed on
Oct 30, 1997
Sold by
Taube Milton and Taube Miklos
Bought by
40 West 56Th St Realty Co Llc
Create a Home Valuation Report for This Property
The Home Valuation Report is an in-depth analysis detailing your home's value as well as a comparison with similar homes in the area
Home Values in the Area
Average Home Value in this Area
Purchase History
| Date | Buyer | Sale Price | Title Company |
|---|---|---|---|
| Nr West 56Th Street Llc | -- | -- | |
| Nrp 56 Llc | $7,000,000 | -- | |
| Fordec Realty Corp | -- | -- | |
| 40 West 56 Llc | $1,600,000 | -- | |
| 40 West 56Th St Realty Co Llc | -- | -- |
Source: Public Records
Mortgage History
| Date | Status | Borrower | Loan Amount |
|---|---|---|---|
| Open | Nr West 56Th Street Llc | $6,000,000 | |
| Previous Owner | Fordec Realty Corp | $2,200,000 |
Source: Public Records
Tax History Compared to Growth
Tax History
| Year | Tax Paid | Tax Assessment Tax Assessment Total Assessment is a certain percentage of the fair market value that is determined by local assessors to be the total taxable value of land and additions on the property. | Land | Improvement |
|---|---|---|---|---|
| 2025 | $80,956 | $699,345 | $199,045 | $500,300 |
| 2024 | $80,956 | $647,543 | $1,566,000 | $447,151 |
| 2023 | $79,434 | $647,543 | $240,471 | $407,072 |
| 2022 | $76,771 | $4,568,400 | $1,566,000 | $3,002,400 |
| 2021 | $71,271 | $3,653,100 | $1,566,000 | $2,087,100 |
| 2020 | $67,100 | $3,842,100 | $1,566,000 | $2,276,100 |
| 2019 | $62,822 | $3,791,700 | $1,566,000 | $2,225,700 |
| 2018 | $63,355 | $498,110 | $190,193 | $307,917 |
| 2017 | $61,391 | $482,672 | $210,515 | $272,157 |
| 2016 | $57,617 | $446,919 | $214,847 | $232,072 |
| 2015 | $32,048 | $413,814 | $198,823 | $214,991 |
| 2014 | $32,048 | $383,162 | $220,908 | $162,254 |
Source: Public Records
Map
Nearby Homes
- 33 W 56th St Unit 4E
- 27 W 55th St Unit 44
- 77 W 55th St Unit 7F
- 77 W 55th St Unit 2H
- 77 W 55th St Unit 9F
- 77 W 55th St Unit 9K
- 77 W 55th St Unit 6G
- 77 W 55th St Unit 10H
- 77 W 55th St Unit 11 JK
- 77 W 55th St Unit 16A
- 24 W 55th St Unit 2G
- 24 W 55th St Unit 10E
- 24 W 55th St Unit 11-D
- 24 W 55th St Unit 7 F
- 730 5th Ave Unit 17B
- 730 5th Ave Unit 18A
- 730 5th Ave Unit 18B
- 17 W 54th St Unit 10A
- 17 W 54th St Unit 11D
- 58 W 58th St Unit 24B
- 40 W 56th St Unit 3F
- 40 W 56th St Unit 5F
- 40 W 56th St Unit 4F
- 42 W 56th St Unit 4A
- 42 W 56th St
- 42 W 56th St Unit 3A
- 42 W 56th St Unit 2B
- 38 W 56th St
- 38 W 56th St Unit 3r
- 38 W 56th St Unit 5
- 44 W 56th St
- 44 W 56th St Unit 4
- 36 W 56th St
- 46 W 56th St
- 34 W 56th St
- 48-50 W 56th St
- 30 W 56th St
- 39 W 56th St
- 33 W 56th St
- 33 W 56th St Unit PH2B