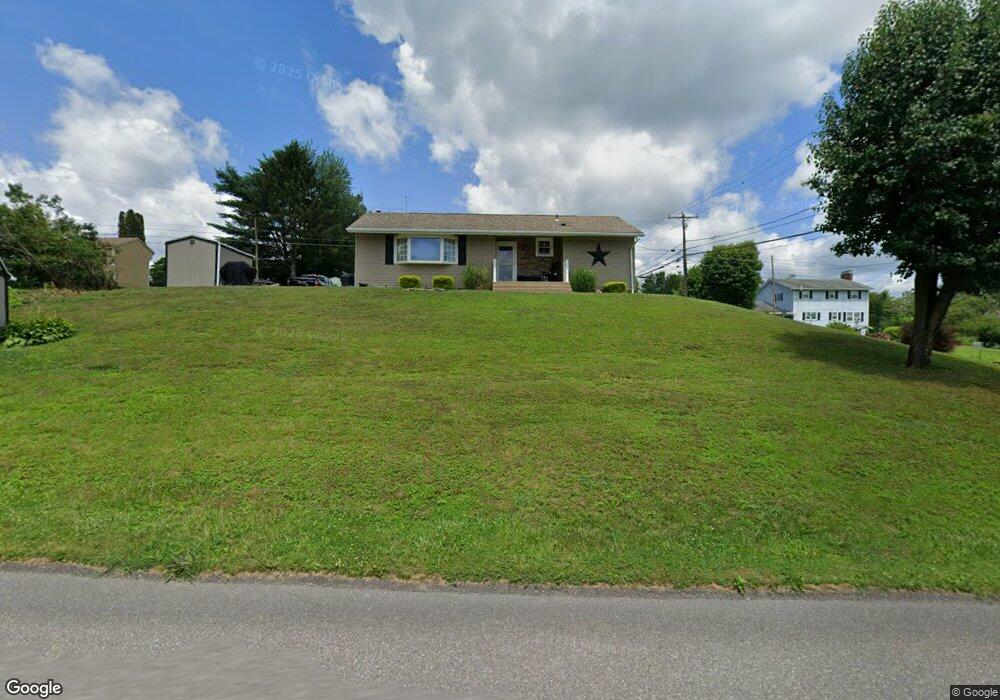
40 Wayne Ave Tamaqua, PA 18252
Estimated Value: $194,000 - $259,000
3
Beds
2
Baths
1,255
Sq Ft
$179/Sq Ft
Est. Value
About This Home
This home is located at 40 Wayne Ave, Tamaqua, PA 18252 and is currently estimated at $224,665, approximately $179 per square foot. 40 Wayne Ave is a home located in Schuylkill County with nearby schools including Tamaqua Area Senior High School and Marian Catholic High School.
Ownership History
Date
Name
Owned For
Owner Type
Purchase Details
Closed on
Sep 30, 2024
Sold by
Boyer William B
Bought by
Knadler Jeffrey R and Ceasar Victoria M
Current Estimated Value
Home Financials for this Owner
Home Financials are based on the most recent Mortgage that was taken out on this home.
Original Mortgage
$197,600
Outstanding Balance
$195,566
Interest Rate
6.46%
Mortgage Type
New Conventional
Estimated Equity
$29,099
Purchase Details
Closed on
Sep 29, 2023
Sold by
Boyer Lori A
Bought by
Boyer William B
Purchase Details
Closed on
Jul 30, 2007
Sold by
Banavage April M and Banavage Bruce W
Bought by
Boyer William B and Boyer Lori A
Home Financials for this Owner
Home Financials are based on the most recent Mortgage that was taken out on this home.
Original Mortgage
$112,883
Interest Rate
6.73%
Mortgage Type
FHA
Create a Home Valuation Report for This Property
The Home Valuation Report is an in-depth analysis detailing your home's value as well as a comparison with similar homes in the area
Home Values in the Area
Average Home Value in this Area
Purchase History
| Date | Buyer | Sale Price | Title Company |
|---|---|---|---|
| Knadler Jeffrey R | $208,000 | Carbon Search & Settlement Ser | |
| Boyer William B | -- | None Listed On Document | |
| Boyer William B | $114,000 | None Available |
Source: Public Records
Mortgage History
| Date | Status | Borrower | Loan Amount |
|---|---|---|---|
| Open | Knadler Jeffrey R | $197,600 | |
| Previous Owner | Boyer William B | $112,883 |
Source: Public Records
Tax History Compared to Growth
Tax History
| Year | Tax Paid | Tax Assessment Tax Assessment Total Assessment is a certain percentage of the fair market value that is determined by local assessors to be the total taxable value of land and additions on the property. | Land | Improvement |
|---|---|---|---|---|
| 2025 | $2,984 | $42,520 | $14,030 | $28,490 |
| 2024 | $3,181 | $42,520 | $14,030 | $28,490 |
| 2023 | $2,669 | $42,520 | $14,030 | $28,490 |
| 2022 | $2,587 | $42,520 | $14,030 | $28,490 |
| 2021 | $2,613 | $42,520 | $14,030 | $28,490 |
| 2020 | $2,554 | $42,520 | $14,030 | $28,490 |
| 2018 | $2,474 | $42,520 | $14,030 | $28,490 |
| 2017 | $2,380 | $42,520 | $14,030 | $28,490 |
| 2015 | -- | $42,520 | $14,030 | $28,490 |
| 2011 | -- | $42,520 | $0 | $0 |
Source: Public Records
Map
Nearby Homes
- 0 Ryan Ave
- 1080 Claremont Ave
- 26 Lincoln Dr
- 1 Lafayette Ave
- 57 Ardmore Ave
- 225 Claremont Ave
- 0 Lincoln Dr Unit 765974
- 0 Lincoln Dr Unit PASK2023774
- 0 Lincoln Dr Unit PM-136722
- 0 Lincoln Dr
- 0 Lincoln Dr Unit 725051
- East Lincoln St
- 603 Brew St
- 533 N Railroad St
- 515 N Railroad St
- 504 Pine St
- 500 Pine St
- 433 N Railroad St
- 0 Claremont Ave Unit 8-8824
- 11 W Elm St