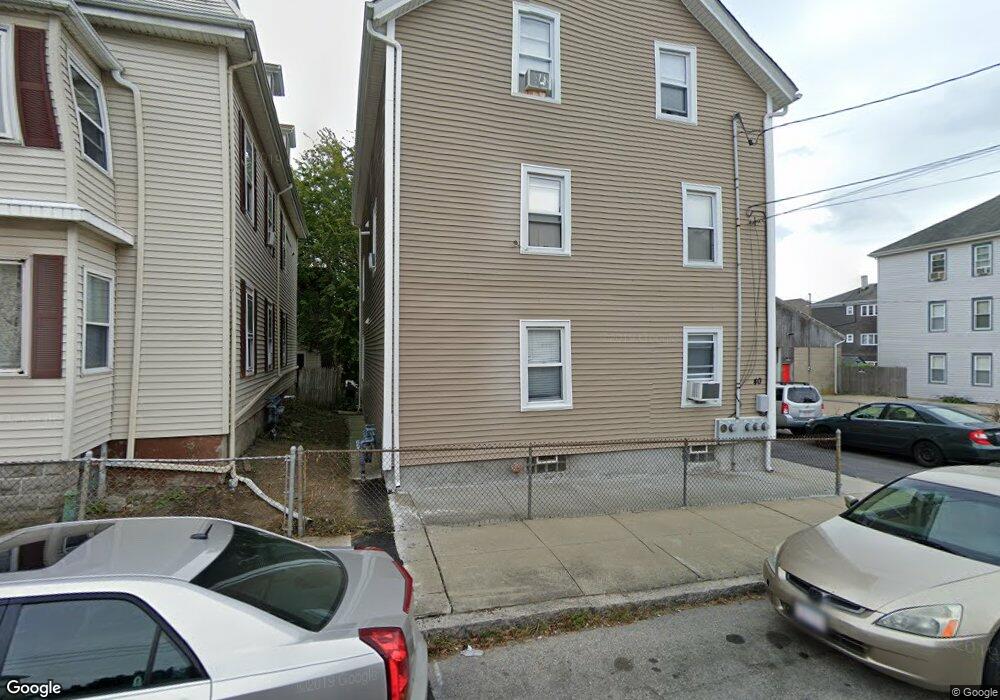
40 Wilbur St Fall River, MA 02724
Father Kelly NeighborhoodEstimated Value: $571,000 - $645,000
5
Beds
3
Baths
2,785
Sq Ft
$220/Sq Ft
Est. Value
About This Home
This home is located at 40 Wilbur St, Fall River, MA 02724 and is currently estimated at $613,667, approximately $220 per square foot. 40 Wilbur St is a home located in Bristol County with nearby schools including Carlton M. Viveiros Elementary School, Matthew J. Kuss Middle School, and B M C Durfee High School.
Ownership History
Date
Name
Owned For
Owner Type
Purchase Details
Closed on
Nov 1, 1999
Sold by
Szember Mary Est
Bought by
Langlois Reney E
Current Estimated Value
Home Financials for this Owner
Home Financials are based on the most recent Mortgage that was taken out on this home.
Original Mortgage
$76,000
Interest Rate
7.78%
Mortgage Type
Purchase Money Mortgage
Create a Home Valuation Report for This Property
The Home Valuation Report is an in-depth analysis detailing your home's value as well as a comparison with similar homes in the area
Home Values in the Area
Average Home Value in this Area
Purchase History
| Date | Buyer | Sale Price | Title Company |
|---|---|---|---|
| Langlois Reney E | $80,000 | -- |
Source: Public Records
Mortgage History
| Date | Status | Borrower | Loan Amount |
|---|---|---|---|
| Open | Langlois Reney E | $112,500 | |
| Closed | Langlois Reney E | $15,321 | |
| Closed | Langlois Reney E | $76,000 |
Source: Public Records
Tax History
| Year | Tax Paid | Tax Assessment Tax Assessment Total Assessment is a certain percentage of the fair market value that is determined by local assessors to be the total taxable value of land and additions on the property. | Land | Improvement |
|---|---|---|---|---|
| 2025 | $5,150 | $449,800 | $107,500 | $342,300 |
| 2024 | $4,934 | $429,400 | $103,600 | $325,800 |
| 2023 | $4,268 | $347,800 | $85,600 | $262,200 |
| 2022 | $3,833 | $303,700 | $81,500 | $222,200 |
| 2021 | $3,673 | $265,600 | $77,500 | $188,100 |
| 2020 | $3,351 | $231,900 | $76,400 | $155,500 |
| 2019 | $2,915 | $199,900 | $73,600 | $126,300 |
| 2018 | $2,852 | $195,100 | $79,700 | $115,400 |
| 2017 | $2,680 | $191,400 | $76,000 | $115,400 |
| 2016 | $2,639 | $193,600 | $80,800 | $112,800 |
| 2015 | $2,438 | $186,400 | $80,800 | $105,600 |
| 2014 | $2,435 | $193,600 | $78,400 | $115,200 |
Source: Public Records
Map
Nearby Homes
- 1334 S Main St
- 344-354 E Main St
- 1273-1279 S Main St
- 219 Montaup St
- 240 Montaup St
- 71 Mystic St Unit 3
- 82 Montaup St
- 340 Vale St
- 917 Dwelly St
- 20 Wilcox St
- 234 Kilburn St
- 355 Peckham St
- 70 Brown St
- 119 Pebble St
- 1846 S Main St
- 1852 S Main St
- 250 Laurel St
- 158 Forest St
- 150 Forest St
- 609 King Philip St
- 28 Wilbur St
- 52 Wilbur St
- 56 Wilbur St
- 22 Wilbur St Unit 2S
- 14 Wilbur St
- 273 & 281 E Main St
- 35 Wilbur St
- 297 E Main St
- 253 E Main St
- 263 E Main St Unit 265
- 119 Palmer St
- 68 Wilbur St
- 47 Wilbur St
- 107 Palmer St Unit 2
- 107 Palmer St Unit 3
- 23 Wilbur St
- 17 Wilbur St
- 48 Saucier St
- 67 Wilbur St
- 67 Wilbur St Unit 3
Your Personal Tour Guide
Ask me questions while you tour the home.