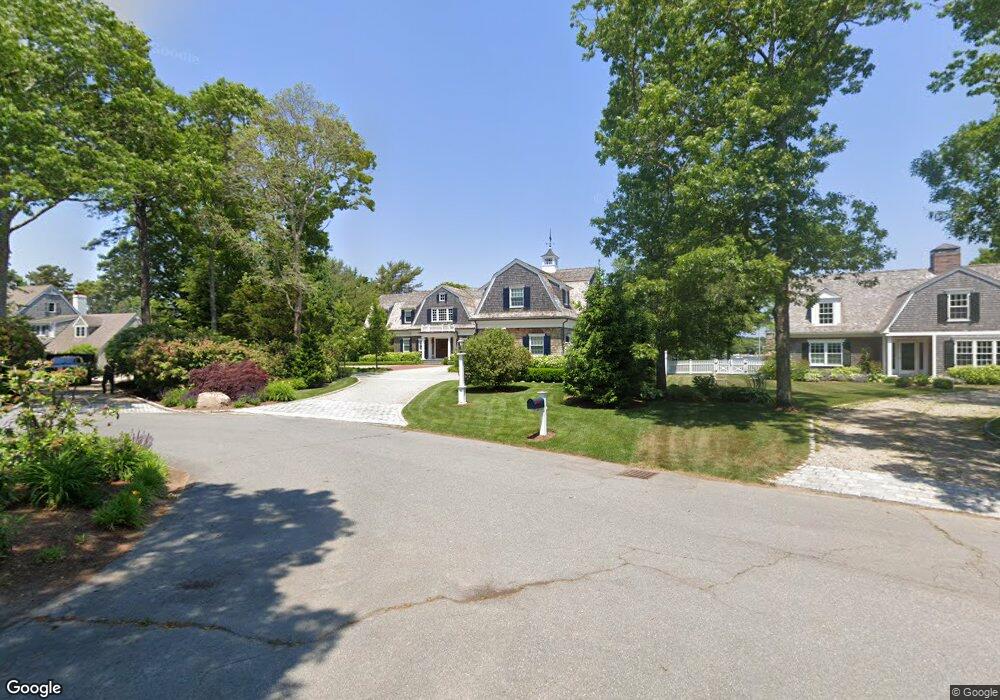
40 Windrush Ln Osterville, MA 02655
Osterville NeighborhoodEstimated Value: $6,757,000 - $7,702,000
7
Beds
7
Baths
6,468
Sq Ft
$1,127/Sq Ft
Est. Value
About This Home
This home is located at 40 Windrush Ln, Osterville, MA 02655 and is currently estimated at $7,292,296, approximately $1,127 per square foot. 40 Windrush Ln is a home located in Barnstable County with nearby schools including West Villages Elementary School, Barnstable United Elementary School, and Barnstable Intermediate School.
Ownership History
Date
Name
Owned For
Owner Type
Purchase Details
Closed on
Oct 22, 1992
Sold by
Emery Donald K and Emery Manijeh M
Bought by
Vigoda Robert A
Current Estimated Value
Home Financials for this Owner
Home Financials are based on the most recent Mortgage that was taken out on this home.
Original Mortgage
$750,000
Interest Rate
7.79%
Mortgage Type
Purchase Money Mortgage
Purchase Details
Closed on
Jan 6, 1987
Sold by
Pheeney Herbert S
Bought by
Emery Donald K
Create a Home Valuation Report for This Property
The Home Valuation Report is an in-depth analysis detailing your home's value as well as a comparison with similar homes in the area
Home Values in the Area
Average Home Value in this Area
Purchase History
| Date | Buyer | Sale Price | Title Company |
|---|---|---|---|
| Vigoda Robert A | $1,200,000 | -- | |
| Emery Donald K | $1,400,000 | -- |
Source: Public Records
Mortgage History
| Date | Status | Borrower | Loan Amount |
|---|---|---|---|
| Closed | Emery Donald K | $750,000 | |
| Closed | Emery Donald K | $250,000 |
Source: Public Records
Tax History
| Year | Tax Paid | Tax Assessment Tax Assessment Total Assessment is a certain percentage of the fair market value that is determined by local assessors to be the total taxable value of land and additions on the property. | Land | Improvement |
|---|---|---|---|---|
| 2025 | $51,153 | $6,323,000 | $2,211,400 | $4,111,600 |
| 2024 | $47,589 | $6,093,300 | $2,211,400 | $3,881,900 |
| 2023 | $41,802 | $5,012,200 | $1,769,700 | $3,242,500 |
| 2022 | $45,670 | $4,737,500 | $2,028,500 | $2,709,000 |
| 2021 | $44,502 | $4,242,300 | $1,670,500 | $2,571,800 |
| 2020 | $27,494 | $2,508,600 | $1,652,000 | $856,600 |
| 2019 | $26,667 | $2,364,100 | $1,747,200 | $616,900 |
| 2018 | $26,582 | $2,369,200 | $1,839,300 | $529,900 |
| 2017 | $25,262 | $2,347,800 | $1,839,300 | $508,500 |
| 2016 | $26,095 | $2,394,000 | $1,885,500 | $508,500 |
| 2015 | $24,708 | $2,277,200 | $1,762,000 | $515,200 |
Source: Public Records
Map
Nearby Homes
- 414 Eel
- 67 Fire Station Rd
- 71 Sand Point
- 33 Sunset Ln
- 39 Blossom Ave Unit 4
- 920 Main St Unit 1 Building 2
- 920 Main St Unit 2-1
- 168 Garrison Ln
- 39 Tower Hill Rd Unit 1C
- 39 Tower Hill Rd Unit 18A
- 98 Bunker Hill Rd
- 146 Scudder Rd
- 835 Old Post Rd
- 414 Eel River Rd
- 14 Indian Trail
- Lot 289 Seapuit River B Rd
- Lot 288 Seapuit River A Rd
- 850 Sea View Ave
- 501 Eel River Rd
- 40 Waterfield Rd
Your Personal Tour Guide
Ask me questions while you tour the home.