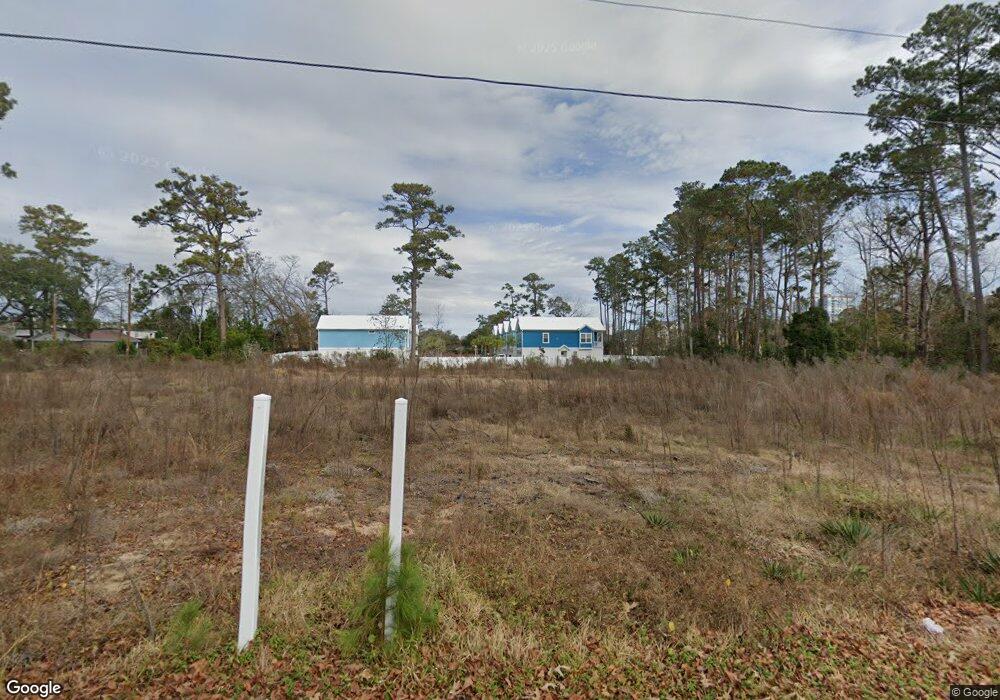
400 25th Ave S Myrtle Beach, SC 29577
Estimated Value: $998,000 - $1,129,000
7
Beds
8
Baths
5,222
Sq Ft
$204/Sq Ft
Est. Value
About This Home
This home is located at 400 25th Ave S, Myrtle Beach, SC 29577 and is currently estimated at $1,063,500, approximately $203 per square foot. 400 25th Ave S is a home located in Horry County with nearby schools including Myrtle Beach Child Development Center, Myrtle Beach Primary School, and Myrtle Beach Elementary School.
Ownership History
Date
Name
Owned For
Owner Type
Purchase Details
Closed on
Jun 27, 2025
Sold by
Lp Townhome Development Company Llc
Bought by
Landing At 25 Llc
Current Estimated Value
Purchase Details
Closed on
Mar 6, 2025
Sold by
Kinfolks Investments Llc
Bought by
Lp Townhome Development Company Llc
Home Financials for this Owner
Home Financials are based on the most recent Mortgage that was taken out on this home.
Original Mortgage
$1,450,000
Interest Rate
6.89%
Mortgage Type
New Conventional
Purchase Details
Closed on
Aug 11, 2023
Sold by
25Th Avenue Llc
Bought by
Kinfolks Investments Llc
Home Financials for this Owner
Home Financials are based on the most recent Mortgage that was taken out on this home.
Original Mortgage
$90,000
Interest Rate
6.96%
Mortgage Type
New Conventional
Purchase Details
Closed on
Jun 7, 2005
Sold by
Idc Development Inc
Bought by
25Th Avenue Llc
Create a Home Valuation Report for This Property
The Home Valuation Report is an in-depth analysis detailing your home's value as well as a comparison with similar homes in the area
Home Values in the Area
Average Home Value in this Area
Purchase History
| Date | Buyer | Sale Price | Title Company |
|---|---|---|---|
| Landing At 25 Llc | $2,000,000 | -- | |
| Lp Townhome Development Company Llc | $1,500,000 | -- | |
| Kinfolks Investments Llc | $850,000 | -- | |
| 25Th Avenue Llc | $795,000 | -- |
Source: Public Records
Mortgage History
| Date | Status | Borrower | Loan Amount |
|---|---|---|---|
| Previous Owner | Lp Townhome Development Company Llc | $1,450,000 | |
| Previous Owner | Kinfolks Investments Llc | $90,000 | |
| Previous Owner | Kinfolks Investments Llc | $720,000 |
Source: Public Records
Tax History Compared to Growth
Tax History
| Year | Tax Paid | Tax Assessment Tax Assessment Total Assessment is a certain percentage of the fair market value that is determined by local assessors to be the total taxable value of land and additions on the property. | Land | Improvement |
|---|---|---|---|---|
| 2024 | $23,057 | $90,561 | $90,561 | $0 |
| 2023 | $23,057 | $42,965 | $31,049 | $11,916 |
| 2021 | $11,610 | $42,965 | $31,049 | $11,916 |
| 2020 | $11,073 | $42,965 | $31,049 | $11,916 |
| 2019 | $11,073 | $42,965 | $31,049 | $11,916 |
| 2018 | $0 | $38,705 | $31,049 | $7,656 |
| 2017 | $10,181 | $38,705 | $31,049 | $7,656 |
| 2016 | -- | $38,705 | $31,049 | $7,656 |
| 2015 | $10,065 | $38,706 | $31,050 | $7,656 |
| 2014 | $9,786 | $38,706 | $31,050 | $7,656 |
Source: Public Records
Map
Nearby Homes
- 400 Flounder Way Unit E
- 400 Flounder Way Unit D
- 400 Flounder Way Unit C
- 400 Flounder Way Unit B
- 400 Flounder Way Unit A
- 401 Flounder Way Unit E
- 401 Flounder Way Unit D
- 401 Flounder Way Unit C
- 401 Flounder Way Unit B
- 401 Flounder Way Unit A
- 410 Flounder Way Unit E
- 410 Flounder Way Unit D
- 410 Flounder Way Unit C
- 410 Flounder Way Unit B
- 410 Flounder Way Unit A
- 2406 Seabreeze Place
- TBD 24th Ave S Unit Lot E
- TBD 24th Ave S Unit Lot F
- TBD 24th Ave S Unit Lot G
- 2513 Clearwater St
- 400 25th Ave S Unit 400 25th Avenue Sout
- 2409 Seabreeze Place Unit Lot 6
- 2409 Seabreeze Place
- 2410 Seabreeze Place
- 2408 Seabreeze Place
- 2407 Seabreeze Place
- 2407 Seabreeze Place Unit Lot 7
- 2407 Seabreeze Place
- 334 25th Ave S
- TBD 24th Ave S
- 2406 Seabreeze Place Unit Lot 3
- 2405 Seabreeze Place Unit Lot 8
- 2405 Seabreeze Place
- 2504 Clearwater St
- 2503 Clearwater St
- 2403 Seabreeze Place
- 2404 Seabreeze Place
- 2402 Seabreeze Place
- 326 25th Ave S Unit MB
- 2401 Seabreeze Place Unit Lot 10