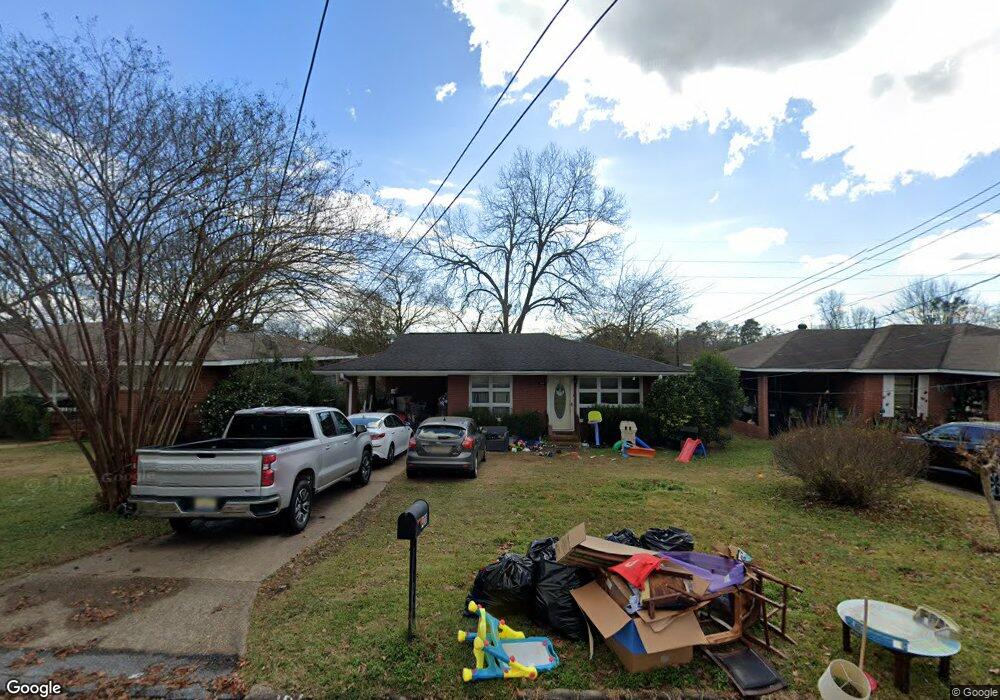
400 46th St Columbus, GA 31904
Northern Columbus NeighborhoodEstimated Value: $104,000 - $139,000
2
Beds
3
Baths
1,144
Sq Ft
$110/Sq Ft
Est. Value
About This Home
This home is located at 400 46th St, Columbus, GA 31904 and is currently estimated at $125,883, approximately $110 per square foot. 400 46th St is a home located in Muscogee County with nearby schools including River Road Elementary School, Double Churches Middle School, and Jordan Vocational High School.
Ownership History
Date
Name
Owned For
Owner Type
Purchase Details
Closed on
Aug 15, 2025
Sold by
Wiggy Investments Llc
Bought by
Plex Cvr Ii Llc
Current Estimated Value
Home Financials for this Owner
Home Financials are based on the most recent Mortgage that was taken out on this home.
Original Mortgage
$4,000,000
Outstanding Balance
$3,760,334
Interest Rate
6.72%
Mortgage Type
Construction
Estimated Equity
-$3,634,451
Purchase Details
Closed on
Sep 21, 2020
Sold by
Glore Tina Marie
Bought by
Wiggy Investments Llc
Purchase Details
Closed on
Jun 30, 2020
Sold by
Glore Ronald Brad
Bought by
Glore Tina Marie
Purchase Details
Closed on
Apr 2, 2013
Sold by
Romeo Rhonda Phillips
Bought by
Glore Ronald Brad
Home Financials for this Owner
Home Financials are based on the most recent Mortgage that was taken out on this home.
Original Mortgage
$47,600
Interest Rate
3.55%
Mortgage Type
New Conventional
Create a Home Valuation Report for This Property
The Home Valuation Report is an in-depth analysis detailing your home's value as well as a comparison with similar homes in the area
Home Values in the Area
Average Home Value in this Area
Purchase History
| Date | Buyer | Sale Price | Title Company |
|---|---|---|---|
| Plex Cvr Ii Llc | $190,000 | None Listed On Document | |
| Wiggy Investments Llc | -- | -- | |
| Glore Tina Marie | -- | -- | |
| Glore Ronald Brad | $59,500 | -- |
Source: Public Records
Mortgage History
| Date | Status | Borrower | Loan Amount |
|---|---|---|---|
| Open | Plex Cvr Ii Llc | $4,000,000 | |
| Previous Owner | Glore Ronald Brad | $47,600 |
Source: Public Records
Tax History Compared to Growth
Tax History
| Year | Tax Paid | Tax Assessment Tax Assessment Total Assessment is a certain percentage of the fair market value that is determined by local assessors to be the total taxable value of land and additions on the property. | Land | Improvement |
|---|---|---|---|---|
| 2025 | $1,583 | $40,448 | $9,372 | $31,076 |
| 2024 | $1,583 | $40,448 | $9,372 | $31,076 |
| 2023 | $1,593 | $40,448 | $9,372 | $31,076 |
| 2022 | $1,197 | $29,328 | $7,028 | $22,300 |
| 2021 | $1,185 | $29,016 | $7,028 | $21,988 |
| 2020 | $1,185 | $29,016 | $7,028 | $21,988 |
| 2019 | $1,189 | $29,016 | $7,028 | $21,988 |
| 2018 | $1,189 | $29,016 | $7,028 | $21,988 |
| 2017 | $1,193 | $29,016 | $7,028 | $21,988 |
| 2016 | $982 | $23,800 | $2,640 | $21,160 |
| 2015 | $983 | $23,800 | $2,640 | $21,160 |
| 2014 | $984 | $23,800 | $2,640 | $21,160 |
| 2013 | -- | $26,137 | $2,640 | $23,497 |
Source: Public Records
Map
Nearby Homes