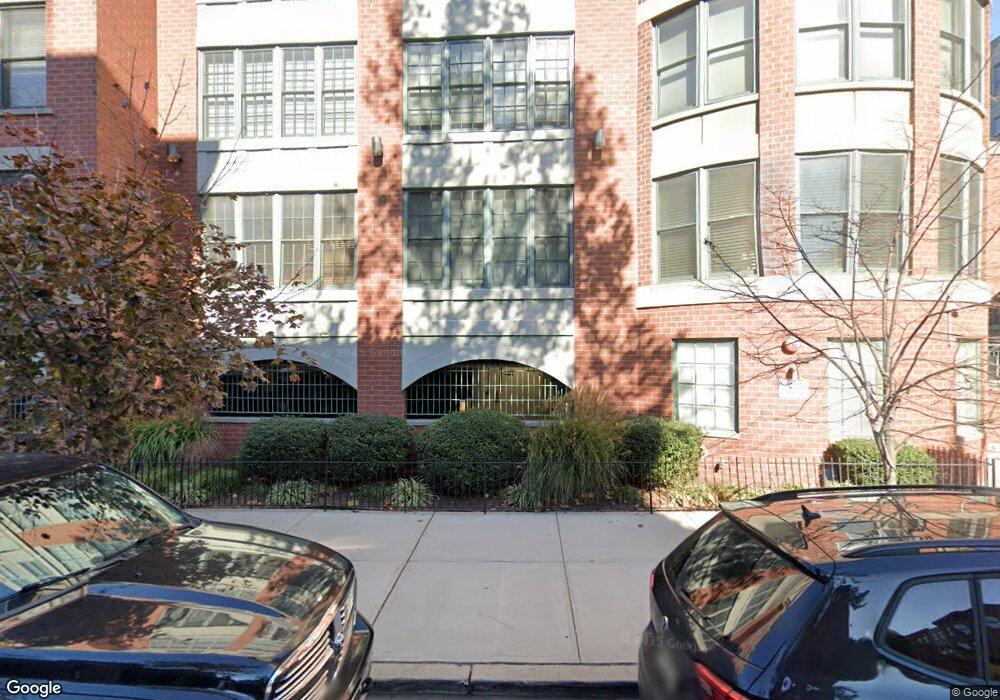
400 9th St Unit 414 Hoboken, NJ 07030
Estimated Value: $809,000 - $1,118,000
1
Bed
--
Bath
995
Sq Ft
$910/Sq Ft
Est. Value
About This Home
This home is located at 400 9th St Unit 414, Hoboken, NJ 07030 and is currently estimated at $905,067, approximately $909 per square foot. 400 9th St Unit 414 is a home located in Hudson County with nearby schools including Hoboken High School, Hoboken Charter School, and Hoboken Catholic Academy.
Ownership History
Date
Name
Owned For
Owner Type
Purchase Details
Closed on
Jul 18, 2016
Sold by
Proter Kevin
Bought by
Wong Scott C
Current Estimated Value
Home Financials for this Owner
Home Financials are based on the most recent Mortgage that was taken out on this home.
Original Mortgage
$461,300
Outstanding Balance
$367,781
Interest Rate
3.54%
Mortgage Type
New Conventional
Estimated Equity
$537,286
Purchase Details
Closed on
Jul 13, 2006
Sold by
Wiatrak Matthew and Wiatrak Torri
Bought by
Porter Kevin
Purchase Details
Closed on
Feb 23, 2005
Sold by
Sadler Jordan and Sadler Keri
Bought by
Savidge Terri and Wistrak Matthew J
Home Financials for this Owner
Home Financials are based on the most recent Mortgage that was taken out on this home.
Original Mortgage
$45,900
Interest Rate
5.64%
Mortgage Type
Stand Alone Second
Create a Home Valuation Report for This Property
The Home Valuation Report is an in-depth analysis detailing your home's value as well as a comparison with similar homes in the area
Home Values in the Area
Average Home Value in this Area
Purchase History
| Date | Buyer | Sale Price | Title Company |
|---|---|---|---|
| Wong Scott C | $659,000 | Lt National Title Services | |
| Porter Kevin | $505,000 | None Available | |
| Savidge Terri | $459,000 | Multiple |
Source: Public Records
Mortgage History
| Date | Status | Borrower | Loan Amount |
|---|---|---|---|
| Open | Wong Scott C | $461,300 | |
| Previous Owner | Savidge Terri | $45,900 | |
| Previous Owner | Savidge Terri | $367,200 |
Source: Public Records
Tax History Compared to Growth
Tax History
| Year | Tax Paid | Tax Assessment Tax Assessment Total Assessment is a certain percentage of the fair market value that is determined by local assessors to be the total taxable value of land and additions on the property. | Land | Improvement |
|---|---|---|---|---|
| 2025 | $9,222 | $522,200 | $181,000 | $341,200 |
| 2024 | $8,507 | $522,200 | $181,000 | $341,200 |
| 2023 | $8,507 | $522,200 | $181,000 | $341,200 |
| 2022 | $8,360 | $522,200 | $181,000 | $341,200 |
| 2021 | $8,355 | $522,200 | $181,000 | $341,200 |
| 2020 | $8,413 | $522,200 | $181,000 | $341,200 |
| 2019 | $8,350 | $522,200 | $181,000 | $341,200 |
| 2018 | $8,251 | $522,200 | $181,000 | $341,200 |
| 2017 | $8,313 | $522,200 | $181,000 | $341,200 |
| 2016 | $8,099 | $522,200 | $181,000 | $341,200 |
| 2015 | $7,817 | $507,200 | $181,000 | $326,200 |
| 2014 | $7,243 | $507,200 | $181,000 | $326,200 |
Source: Public Records
Map
Nearby Homes
- 904 Jefferson St Unit 5I
- 1015 Grand St Unit 5F
- 501 9th St Unit 207
- 734 Adams St Unit 4D
- 734 Adams St Unit 2A
- 911 Willow Ave Unit 1
- 720 Clinton St Unit 508
- 720 Clinton St Unit 603
- 815 Willow Ave Unit 2R
- 717 Adams St Unit 4R
- 919 Park Ave Unit 1R
- 1023 Willow Ave Unit A
- 906 Garden St
- 830 Monroe St Unit 2C
- 123 Willow Terrace
- 1201 Adams St Unit 610
- 921 Garden St Unit 3
- 264 7th St Unit 3
- 703 Park Ave Unit 1
- 800 Jackson St Unit 604
- 400 9th St Unit 414
- 400 9th St Unit 414
- 400 9th St Unit 414
- 400 9th St Unit 414
- 400 9th St Unit 414
- 400 9th St Unit 414
- 400 9th St Unit 414
- 400 9th St Unit 414
- 400 9th St Unit 414
- 400 9th St Unit 414
- 400 9th St Unit 414
- 400 9th St Unit 414
- 400 9th St Unit 414
- 400 9th St Unit 414
- 400 9th St Unit 414
- 400 9th St Unit 414
- 400 9th St Unit 414
- 400 9th St Unit 414
- 400 9th St Unit 414
- 400 9th St Unit 414