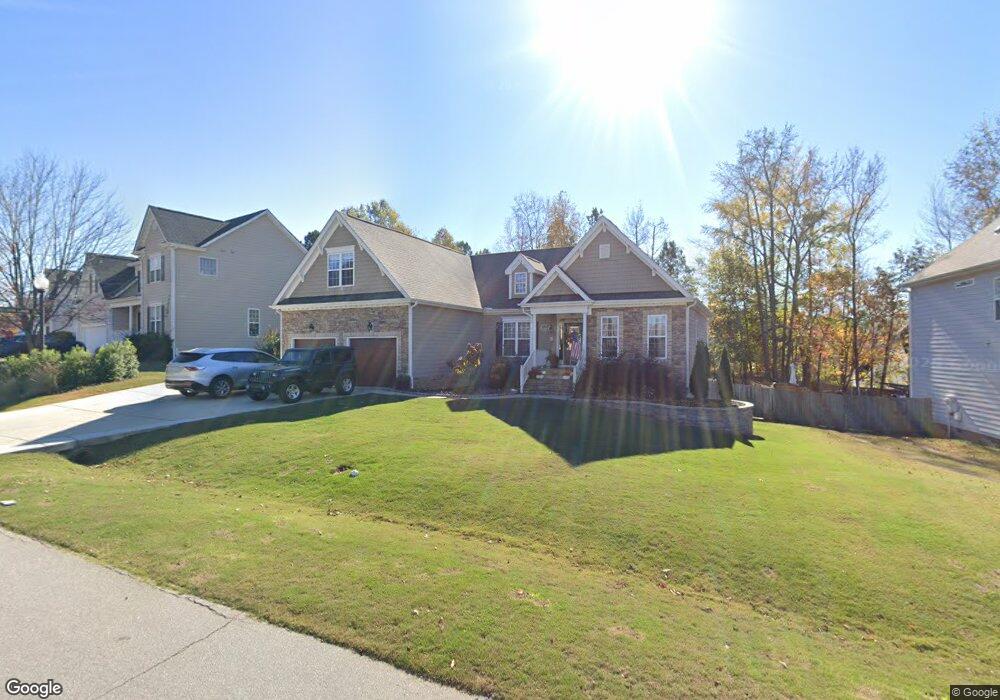
400 Boswell Ln Clayton, NC 27527
Estimated Value: $385,000 - $448,000
3
Beds
3
Baths
2,396
Sq Ft
$171/Sq Ft
Est. Value
About This Home
This home is located at 400 Boswell Ln, Clayton, NC 27527 and is currently estimated at $410,676, approximately $171 per square foot. 400 Boswell Ln is a home located in Johnston County with nearby schools including Riverwood Elementary School, Riverwood Middle School, and Corinth Holders High School.
Ownership History
Date
Name
Owned For
Owner Type
Purchase Details
Closed on
Jul 30, 2018
Sold by
Canterbury Road Properties Llc
Bought by
Lewis David W and Lewis Laura S
Current Estimated Value
Home Financials for this Owner
Home Financials are based on the most recent Mortgage that was taken out on this home.
Original Mortgage
$268,000
Outstanding Balance
$233,255
Interest Rate
4.6%
Mortgage Type
VA
Estimated Equity
$177,421
Purchase Details
Closed on
Dec 5, 2014
Sold by
Black & Gold Investments Llc
Bought by
Canterbury Road Properties Llc
Purchase Details
Closed on
Jun 10, 2013
Sold by
Rwac Llc
Bought by
Black & Gold Investments Llc
Home Financials for this Owner
Home Financials are based on the most recent Mortgage that was taken out on this home.
Original Mortgage
$215,000
Interest Rate
3.42%
Mortgage Type
Future Advance Clause Open End Mortgage
Create a Home Valuation Report for This Property
The Home Valuation Report is an in-depth analysis detailing your home's value as well as a comparison with similar homes in the area
Home Values in the Area
Average Home Value in this Area
Purchase History
| Date | Buyer | Sale Price | Title Company |
|---|---|---|---|
| Lewis David W | $268,000 | None Available | |
| Canterbury Road Properties Llc | $1,642,000 | None Available | |
| Black & Gold Investments Llc | -- | None Available |
Source: Public Records
Mortgage History
| Date | Status | Borrower | Loan Amount |
|---|---|---|---|
| Open | Lewis David W | $268,000 | |
| Previous Owner | Black & Gold Investments Llc | $215,000 |
Source: Public Records
Tax History Compared to Growth
Tax History
| Year | Tax Paid | Tax Assessment Tax Assessment Total Assessment is a certain percentage of the fair market value that is determined by local assessors to be the total taxable value of land and additions on the property. | Land | Improvement |
|---|---|---|---|---|
| 2025 | $3,572 | $398,690 | $85,000 | $313,690 |
| 2024 | $2,772 | $255,000 | $42,000 | $213,000 |
| 2023 | $2,626 | $248,530 | $42,000 | $206,530 |
| 2022 | $2,707 | $248,530 | $42,000 | $206,530 |
| 2021 | $2,666 | $248,530 | $42,000 | $206,530 |
| 2020 | $3,330 | $248,530 | $42,000 | $206,530 |
| 2019 | $3,330 | $248,530 | $42,000 | $206,530 |
| 2018 | $0 | $206,260 | $40,000 | $166,260 |
| 2017 | $2,743 | $206,260 | $40,000 | $166,260 |
| 2016 | $2,743 | $206,260 | $40,000 | $166,260 |
| 2015 | $2,692 | $206,260 | $40,000 | $166,260 |
| 2014 | $2,692 | $206,260 | $40,000 | $166,260 |
Source: Public Records
Map
Nearby Homes
- 304 Nelson Ln
- 237 Boswell Ln
- 501 Sarazen Dr
- 200 Mantle Dr
- 400 Charleston Dr
- 329 Chamberlain Dr
- 320 Chamberlain Dr
- 380 Collinsworth Dr
- 201 Sarazen Dr
- 328 Mccarthy Dr
- 147 Michael Way
- 109 Hutson Ln
- 117 Landry Ct
- 524 Woodson Dr
- 629 Woodson Dr
- 10008 Omaha Way
- 76 Omaha Way
- 35 Rockingham Way
- 141 Omaha Way
- 117 Churchill Way