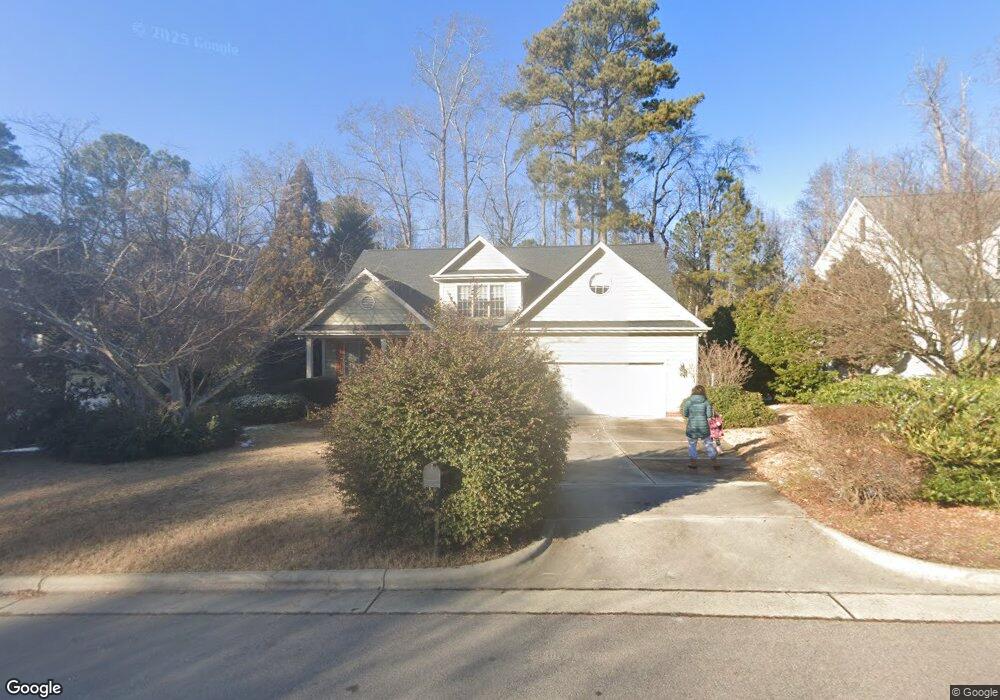
400 Briardale Ave Cary, NC 27519
West Cary NeighborhoodEstimated Value: $904,000 - $955,615
4
Beds
3
Baths
3,364
Sq Ft
$276/Sq Ft
Est. Value
About This Home
This home is located at 400 Briardale Ave, Cary, NC 27519 and is currently estimated at $927,154, approximately $275 per square foot. 400 Briardale Ave is a home located in Wake County with nearby schools including Highcroft Elementary, Mills Park Middle School, and Green Level High School.
Ownership History
Date
Name
Owned For
Owner Type
Purchase Details
Closed on
Jun 21, 2018
Sold by
Hurley David E and Hurley Arlyn D
Bought by
Mason Kathaleen Edith and Mason Mark
Current Estimated Value
Home Financials for this Owner
Home Financials are based on the most recent Mortgage that was taken out on this home.
Original Mortgage
$378,000
Outstanding Balance
$327,638
Interest Rate
4.6%
Mortgage Type
New Conventional
Estimated Equity
$599,516
Purchase Details
Closed on
Dec 27, 2002
Sold by
Rodriguez Rafael and Rodriguez Lilia A
Bought by
Hurley David E and Hurley Arlyn D
Home Financials for this Owner
Home Financials are based on the most recent Mortgage that was taken out on this home.
Original Mortgage
$269,600
Interest Rate
5.92%
Purchase Details
Closed on
Oct 19, 1999
Sold by
Jamestowne Homes Inc
Bought by
Rodriguez Rafael and Rodriguez Lilia A
Home Financials for this Owner
Home Financials are based on the most recent Mortgage that was taken out on this home.
Original Mortgage
$233,900
Interest Rate
7.4%
Create a Home Valuation Report for This Property
The Home Valuation Report is an in-depth analysis detailing your home's value as well as a comparison with similar homes in the area
Home Values in the Area
Average Home Value in this Area
Purchase History
| Date | Buyer | Sale Price | Title Company |
|---|---|---|---|
| Mason Kathaleen Edith | $498,000 | None Available | |
| Hurley David E | $337,000 | -- | |
| Rodriguez Rafael | $292,500 | -- |
Source: Public Records
Mortgage History
| Date | Status | Borrower | Loan Amount |
|---|---|---|---|
| Open | Mason Kathaleen Edith | $378,000 | |
| Previous Owner | Hurley David E | $269,600 | |
| Previous Owner | Rodriguez Rafael | $233,900 |
Source: Public Records
Tax History Compared to Growth
Tax History
| Year | Tax Paid | Tax Assessment Tax Assessment Total Assessment is a certain percentage of the fair market value that is determined by local assessors to be the total taxable value of land and additions on the property. | Land | Improvement |
|---|---|---|---|---|
| 2025 | $8,262 | $961,669 | $310,000 | $651,669 |
| 2024 | $8,084 | $961,669 | $310,000 | $651,669 |
| 2023 | $5,566 | $553,470 | $100,000 | $453,470 |
| 2022 | $5,358 | $553,470 | $100,000 | $453,470 |
| 2021 | $5,250 | $553,470 | $100,000 | $453,470 |
| 2020 | $5,278 | $553,470 | $100,000 | $453,470 |
| 2019 | $5,285 | $491,708 | $128,000 | $363,708 |
| 2018 | $4,959 | $491,708 | $128,000 | $363,708 |
| 2017 | $4,765 | $447,754 | $128,000 | $319,754 |
| 2016 | $4,276 | $447,754 | $128,000 | $319,754 |
| 2015 | $4,325 | $437,287 | $118,000 | $319,287 |
| 2014 | $4,078 | $437,287 | $118,000 | $319,287 |
Source: Public Records
Map
Nearby Homes
- 921 Lemster Ln
- 210 Lindemans Dr
- 5001 Sears Farm Rd
- 102 W Hill Dr
- 108 Ferncroft Ct
- 206 Highfield Ave
- 310 Alamosa Place
- 4110 Sykes St
- 5102 Highcroft Dr
- 536 Rockcastle Dr
- 224 Birdsgrove Ct
- 484 Autumn Rain St
- 400 Boscawen Ln
- 437 Henmore Brook Dr
- 146 Alamosa Place
- 3533 Sienna Hill Place
- 1320 Cozy Oak Ave
- 440 Creekhurst Place
- 2736 Kempthorne Rd
- 2728 Kempthorne Rd
- 314 Briardale Ave
- 402 Briardale Ave
- 312 Briardale Ave
- 100 Caymus Ct
- 101 Caymus Ct
- 310 Briardale Ave
- 406 Briardale Ave
- 512 Edgemore Ave
- 309 Briardale Ave
- 308 Briardale Ave
- 104 Caymus Ct
- 408 Briardale Ave
- 336 Jute Ct
- 105 Caymus Ct
- 332 Jute Ct
- 332 Jute Ct Unit W
- 332 Jute Ct Unit OSFS Lot 111
- 7165 Talton Ridge Dr
- 340 Jute Ct
- 510 Edgemore Ave