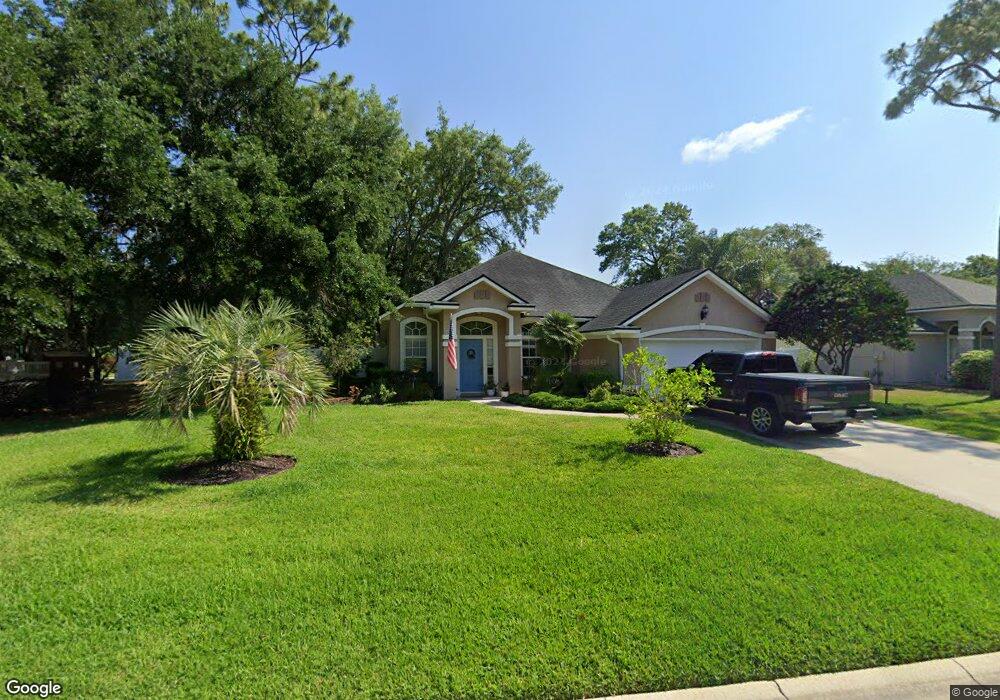
400 Buckeye Ln W Saint Johns, FL 32259
Estimated Value: $422,000 - $486,000
3
Beds
2
Baths
1,820
Sq Ft
$246/Sq Ft
Est. Value
About This Home
This home is located at 400 Buckeye Ln W, Saint Johns, FL 32259 and is currently estimated at $447,876, approximately $246 per square foot. 400 Buckeye Ln W is a home located in St. Johns County with nearby schools including Julington Creek Elementary School, Fruit Cove Middle School, and Creekside High School.
Ownership History
Date
Name
Owned For
Owner Type
Purchase Details
Closed on
Dec 22, 2020
Sold by
Wesolowski Thomas F and Wesolowski Lynn C
Bought by
Pace Stephen and Ruiz Kelley
Current Estimated Value
Home Financials for this Owner
Home Financials are based on the most recent Mortgage that was taken out on this home.
Original Mortgage
$299,155
Outstanding Balance
$266,337
Interest Rate
2.7%
Mortgage Type
New Conventional
Estimated Equity
$181,539
Purchase Details
Closed on
Oct 6, 2017
Sold by
Boyles Scott E
Bought by
Wesolowski Thomas F
Purchase Details
Closed on
May 18, 2017
Sold by
Boyles Sally M
Bought by
Boyles Scott E
Purchase Details
Closed on
Feb 14, 2002
Sold by
Cole Kenneth R and Cole Ruth M
Bought by
Boyles Sally M
Home Financials for this Owner
Home Financials are based on the most recent Mortgage that was taken out on this home.
Original Mortgage
$105,000
Interest Rate
6.95%
Create a Home Valuation Report for This Property
The Home Valuation Report is an in-depth analysis detailing your home's value as well as a comparison with similar homes in the area
Home Values in the Area
Average Home Value in this Area
Purchase History
| Date | Buyer | Sale Price | Title Company |
|---|---|---|---|
| Pace Stephen | $314,900 | Landmark Title | |
| Wesolowski Thomas F | $259,900 | None Available | |
| Boyles Scott E | -- | Attorney | |
| Boyles Sally M | $156,000 | -- |
Source: Public Records
Mortgage History
| Date | Status | Borrower | Loan Amount |
|---|---|---|---|
| Open | Pace Stephen | $299,155 | |
| Previous Owner | Boyles Sally M | $105,000 |
Source: Public Records
Tax History Compared to Growth
Tax History
| Year | Tax Paid | Tax Assessment Tax Assessment Total Assessment is a certain percentage of the fair market value that is determined by local assessors to be the total taxable value of land and additions on the property. | Land | Improvement |
|---|---|---|---|---|
| 2025 | $4,389 | $298,519 | -- | -- |
| 2024 | $4,389 | $290,106 | -- | -- |
| 2023 | $4,389 | $281,656 | $0 | $0 |
| 2022 | $4,294 | $273,452 | $0 | $0 |
| 2021 | $4,065 | $265,487 | $0 | $0 |
| 2020 | $3,318 | $210,272 | $0 | $0 |
| 2019 | $3,367 | $206,028 | $0 | $0 |
| 2018 | $3,294 | $202,186 | $0 | $0 |
| 2017 | $3,494 | $176,087 | $37,000 | $139,087 |
| 2016 | $3,413 | $164,734 | $0 | $0 |
| 2015 | $3,337 | $160,907 | $0 | $0 |
| 2014 | $3,116 | $141,933 | $0 | $0 |
Source: Public Records
Map
Nearby Homes
- 153 Edgewater Branch Dr
- 701 Violet Place
- 681 Lockwood Ln
- 280 Sweetbrier Branch Ln
- 713 Lockwood Ln
- 703 Chesswood Ct
- 263 Sweetbrier Branch Ln
- 2013 Sailview Rd
- 809 Lotus Ln N
- 2316 S Aft Bend
- 1840 Rear Admiral Ln
- 1640 Summerdown Way
- 1800 Rear Admiral Ln
- 705 S Covered Bridge Rd Unit 4
- 709 Tee Time Ln
- 253 Bell Branch Ln
- 1129 Summerchase Dr
- 1104 Summerchase Dr
- 1100 Summerchase Dr
- 348 Southern Branch Ln
- 400 Buckeye Ln E
- 404 Buckeye Ln E
- 261 Maplewood Dr
- 265 Maplewood Dr
- 408 Buckeye Ln E
- 408 E Buckeye
- 405 Buckeye Ln E
- 401 Buckeye Ln E
- 401 Buckeye Ln W
- 269 Maplewood Dr
- 409 Buckeye Ln E
- 412 Buckeye Ln E
- 253 Maplewood Dr
- 413 Buckeye Ln E
- 264 Maplewood Dr
- 273 Maplewood Dr
- 800 Buckeye Ln W
- 268 Maplewood Dr
- 416 Buckeye Ln E
- 417 Buckeye Ln E