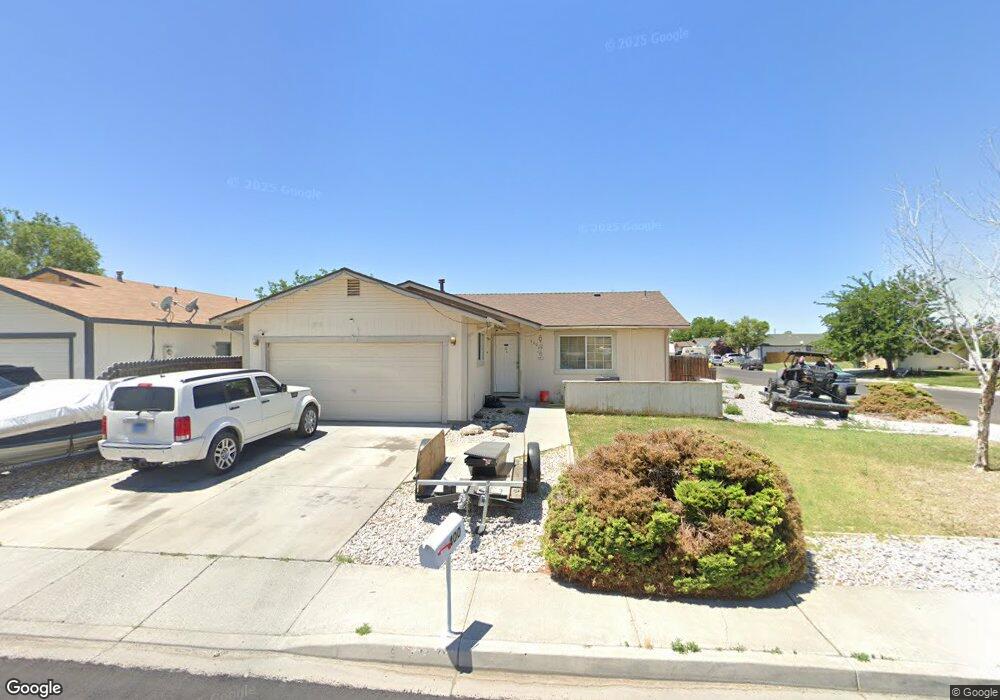
400 Burntwood St Unit 3 Fallon, NV 89406
Estimated Value: $317,000 - $346,000
3
Beds
3
Baths
1,330
Sq Ft
$252/Sq Ft
Est. Value
About This Home
This home is located at 400 Burntwood St Unit 3, Fallon, NV 89406 and is currently estimated at $335,572, approximately $252 per square foot. 400 Burntwood St Unit 3 is a home located in Churchill County with nearby schools including Lahontan Elementary School, E.C. Best Elementary School, and Numa Elementary School.
Ownership History
Date
Name
Owned For
Owner Type
Purchase Details
Closed on
Nov 16, 2011
Sold by
Frey Ranch Llc
Bought by
C & A Rentals Llc
Current Estimated Value
Purchase Details
Closed on
Apr 28, 2011
Sold by
Navy Federal Credit Union
Bought by
Frey Ranch Llc
Purchase Details
Closed on
Mar 15, 2011
Sold by
Branaman Larry Gene
Bought by
Navy Federal Credit Union
Purchase Details
Closed on
Mar 7, 2007
Sold by
Branaman Larry Gene and Branaman Fumiko I
Bought by
Branaman Larry Gene
Purchase Details
Closed on
Feb 22, 2007
Sold by
Branaman Larry Gene and Branaman Fumiko
Bought by
Branaman Larry Gene
Purchase Details
Closed on
Jul 19, 2005
Sold by
Catlin Kenneth N and Catlin Valerie K
Bought by
Branaman Larry G and Branaman Fumiko I
Home Financials for this Owner
Home Financials are based on the most recent Mortgage that was taken out on this home.
Original Mortgage
$50,000
Interest Rate
5.56%
Create a Home Valuation Report for This Property
The Home Valuation Report is an in-depth analysis detailing your home's value as well as a comparison with similar homes in the area
Home Values in the Area
Average Home Value in this Area
Purchase History
| Date | Buyer | Sale Price | Title Company |
|---|---|---|---|
| C & A Rentals Llc | -- | None Available | |
| Frey Ranch Llc | $75,150 | Western Nevada Title Company | |
| Navy Federal Credit Union | $87,998 | Accommodation | |
| Branaman Larry Gene | $10,000 | None Available | |
| Branaman Larry Gene | -- | None Available | |
| Branaman Larry G | $170,000 | Stewart Title Company |
Source: Public Records
Mortgage History
| Date | Status | Borrower | Loan Amount |
|---|---|---|---|
| Previous Owner | Branaman Larry G | $50,000 |
Source: Public Records
Tax History Compared to Growth
Tax History
| Year | Tax Paid | Tax Assessment Tax Assessment Total Assessment is a certain percentage of the fair market value that is determined by local assessors to be the total taxable value of land and additions on the property. | Land | Improvement |
|---|---|---|---|---|
| 2025 | $1,942 | $55,624 | $13,650 | $41,974 |
| 2024 | $1,942 | $55,465 | $12,950 | $42,515 |
| 2023 | $1,942 | $52,205 | $12,250 | $39,955 |
| 2022 | $1,645 | $44,709 | $10,500 | $34,209 |
| 2021 | $1,579 | $43,833 | $10,500 | $33,333 |
| 2020 | $1,523 | $44,647 | $10,500 | $34,147 |
| 2019 | $1,470 | $43,966 | $10,500 | $33,466 |
| 2018 | $1,402 | $39,742 | $7,000 | $32,742 |
| 2017 | $1,346 | $39,851 | $7,000 | $32,851 |
| 2016 | $1,312 | $37,389 | $7,000 | $30,389 |
| 2015 | $1,287 | $34,028 | $7,000 | $27,028 |
| 2014 | $1,250 | $32,579 | $7,875 | $24,704 |
Source: Public Records
Map
Nearby Homes
- 327 Burntwood St
- 1044 Allen Rd
- 521 Whitaker Ln
- 2210 Silver Cir
- 540 Anthony Ln
- 1955 Manchester Cir
- 1475 Cedar Rd
- 1021 Whitaker Ln
- 870 Sunset Dr
- 435 Cindy Ln
- 1380 Pine Rd
- 445 S Allen St
- 620 Sunset Dr
- 575 Babb Place
- APN 007-091-75 Casey Rd
- APN 007-091-74 Casey Rd
- APN 007-091-73 Casey Rd
- APN 007-091-72 Casey Rd
- APN 007-091-71 Casey Rd
- APN 007-091-70 Casey Rd
- 410 Burntwood St
- 415 Mary St
- 1854 Albert St
- 420 Burntwood St
- 425 Mary St
- 1878 Albert St Unit 3
- 409 Burntwood St
- 401 Burntwood St Unit 3
- 425 Burntwood St Unit 1
- 425 Burntwood St
- 417 Burntwood St
- 351 Burntwood St
- 1901 Albert St
- 1857 Grimes St
- 1869 Grimes St
- 435 Burntwood St
- 1881 Grimes St
- 440 Burntwood St
- 1908 Albert St
- 301 Burntwood St