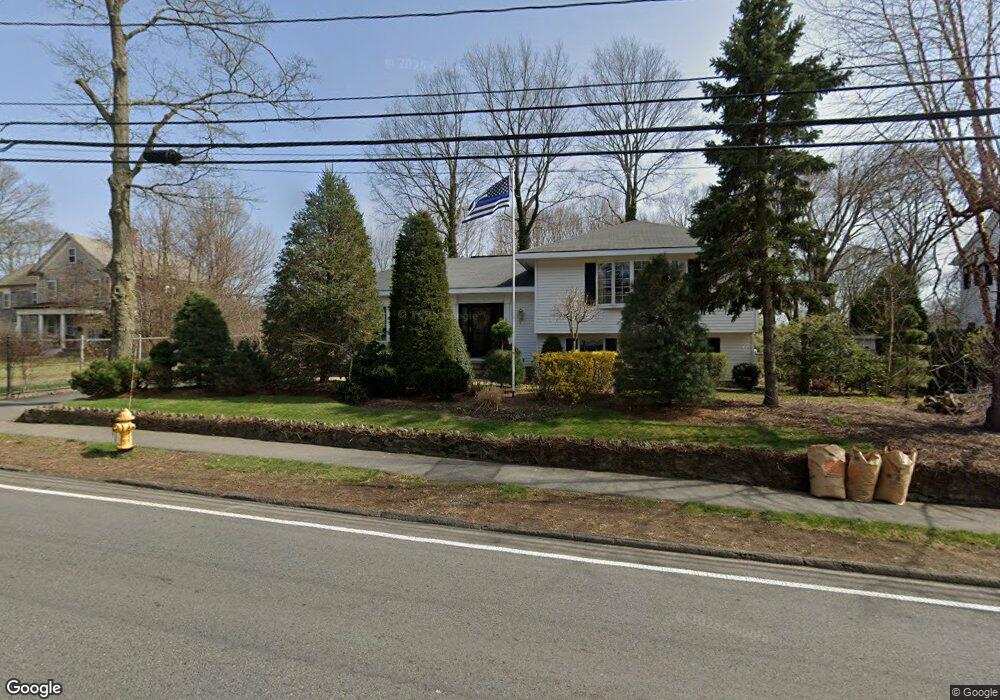
400 Cedar St Dedham, MA 02026
The Manor NeighborhoodEstimated Value: $812,000 - $895,000
3
Beds
5
Baths
1,782
Sq Ft
$482/Sq Ft
Est. Value
About This Home
This home is located at 400 Cedar St, Dedham, MA 02026 and is currently estimated at $858,348, approximately $481 per square foot. 400 Cedar St is a home located in Norfolk County with nearby schools including Greenlodge Elementary School, Dedham Middle School, and Dedham High School.
Ownership History
Date
Name
Owned For
Owner Type
Purchase Details
Closed on
Feb 7, 2023
Sold by
Stow Elizabeth J and Garcia Joseph A
Bought by
390 Cedar Street Llc
Current Estimated Value
Purchase Details
Closed on
Dec 28, 2007
Sold by
Lamb Robert
Bought by
Lamb Brian
Purchase Details
Closed on
May 18, 1984
Bought by
Murphy John F
Create a Home Valuation Report for This Property
The Home Valuation Report is an in-depth analysis detailing your home's value as well as a comparison with similar homes in the area
Home Values in the Area
Average Home Value in this Area
Purchase History
| Date | Buyer | Sale Price | Title Company |
|---|---|---|---|
| 390 Cedar Street Llc | -- | None Available | |
| Lamb Brian | -- | -- | |
| Murphy John F | -- | -- |
Source: Public Records
Mortgage History
| Date | Status | Borrower | Loan Amount |
|---|---|---|---|
| Previous Owner | Murphy John F | $75,000 |
Source: Public Records
Tax History
| Year | Tax Paid | Tax Assessment Tax Assessment Total Assessment is a certain percentage of the fair market value that is determined by local assessors to be the total taxable value of land and additions on the property. | Land | Improvement |
|---|---|---|---|---|
| 2025 | $10,303 | $816,400 | $345,800 | $470,600 |
| 2024 | $9,965 | $797,200 | $313,700 | $483,500 |
| 2023 | $9,441 | $735,300 | $284,000 | $451,300 |
| 2022 | $8,856 | $663,400 | $266,800 | $396,600 |
| 2021 | $8,130 | $594,700 | $247,000 | $347,700 |
| 2020 | $8,199 | $597,600 | $247,000 | $350,600 |
| 2019 | $7,989 | $564,600 | $214,800 | $349,800 |
| 2018 | $7,466 | $513,100 | $187,500 | $325,600 |
| 2017 | $7,429 | $503,300 | $175,600 | $327,700 |
| 2016 | $7,595 | $490,300 | $162,600 | $327,700 |
| 2015 | $7,010 | $441,700 | $162,000 | $279,700 |
| 2014 | $6,733 | $418,700 | $159,100 | $259,600 |
Source: Public Records
Map
Nearby Homes
Your Personal Tour Guide
Ask me questions while you tour the home.