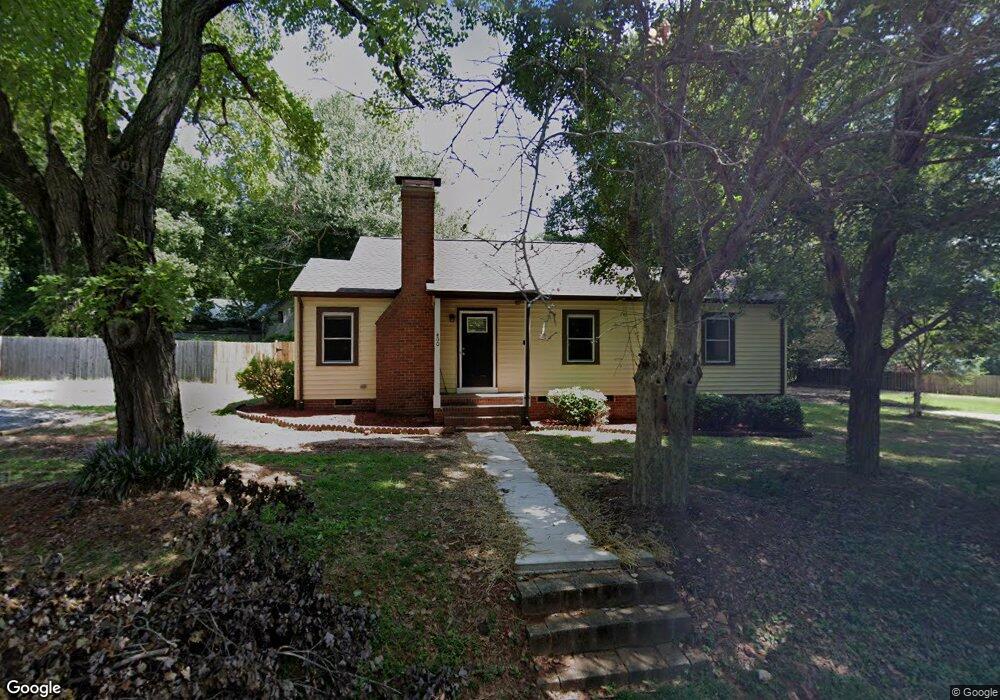
400 Cherry St Belmont, NC 28012
Estimated Value: $229,000 - $269,000
3
Beds
1
Bath
1,128
Sq Ft
$221/Sq Ft
Est. Value
About This Home
This home is located at 400 Cherry St, Belmont, NC 28012 and is currently estimated at $249,516, approximately $221 per square foot. 400 Cherry St is a home located in Gaston County with nearby schools including Catawba Heights Elementary School, Mount Holly Middle School, and South Point High School.
Ownership History
Date
Name
Owned For
Owner Type
Purchase Details
Closed on
Jul 30, 2021
Sold by
Heaven Properties Llc
Bought by
Rs Rental I Llc
Current Estimated Value
Purchase Details
Closed on
Jun 19, 2020
Sold by
Parker Lynda K
Bought by
Heaven Properties Llc
Home Financials for this Owner
Home Financials are based on the most recent Mortgage that was taken out on this home.
Original Mortgage
$172,000
Interest Rate
3.2%
Mortgage Type
Commercial
Purchase Details
Closed on
Oct 31, 2001
Sold by
Finney Michael T
Bought by
Parker Lynda K
Home Financials for this Owner
Home Financials are based on the most recent Mortgage that was taken out on this home.
Original Mortgage
$71,659
Interest Rate
6.74%
Mortgage Type
FHA
Purchase Details
Closed on
Oct 9, 1998
Sold by
Gullion Robert L Cathy G
Bought by
Finney Michael T
Home Financials for this Owner
Home Financials are based on the most recent Mortgage that was taken out on this home.
Original Mortgage
$66,400
Interest Rate
6.95%
Create a Home Valuation Report for This Property
The Home Valuation Report is an in-depth analysis detailing your home's value as well as a comparison with similar homes in the area
Purchase History
| Date | Buyer | Sale Price | Title Company |
|---|---|---|---|
| Rs Rental I Llc | $225,000 | Chicago Title Insurance Co | |
| Heaven Properties Llc | $96,000 | Chicago Title Company Llc | |
| Parker Lynda K | $73,000 | -- | |
| Finney Michael T | $68,500 | -- |
Source: Public Records
Mortgage History
| Date | Status | Borrower | Loan Amount |
|---|---|---|---|
| Previous Owner | Heaven Properties Llc | $172,000 | |
| Previous Owner | Parker Lynda K | $71,659 | |
| Previous Owner | Finney Michael T | $66,400 |
Source: Public Records
Tax History
| Year | Tax Paid | Tax Assessment Tax Assessment Total Assessment is a certain percentage of the fair market value that is determined by local assessors to be the total taxable value of land and additions on the property. | Land | Improvement |
|---|---|---|---|---|
| 2025 | $2,023 | $201,490 | $25,000 | $176,490 |
| 2024 | $2,023 | $201,490 | $25,000 | $176,490 |
| 2023 | $2,045 | $201,490 | $25,000 | $176,490 |
| 2022 | $1,395 | $107,690 | $16,500 | $91,190 |
| 2021 | $1,275 | $96,940 | $16,500 | $80,440 |
| 2019 | $1,284 | $96,940 | $16,500 | $80,440 |
| 2018 | $1,071 | $76,487 | $14,400 | $62,087 |
| 2017 | $1,071 | $76,487 | $14,400 | $62,087 |
| 2016 | $665 | $76,487 | $0 | $0 |
| 2014 | $569 | $65,371 | $18,000 | $47,371 |
Source: Public Records
Map
Nearby Homes
- 228 Brookwood Rd
- 110 W Henry St
- 502 Cherry St
- 511 Cherry St
- 1306 S Main St
- 107 Fire Department Dr
- 374 Moses Rhyne Dr
- 107 Oakland Rd
- 305 E Henry St
- 105 E Catawba Dr
- 128 Coral Rutledge Dr
- 105 Abel Peterson Dr
- 206 E Catawba Dr
- 115 Odaniel St
- 5235 Clearwater Lake Rd
- 101 Oak Trail
- 200 Belmont Mount Holly Rd
- 2301 Acme Rd
- 1525 Perfection Ave
- 313 Bell St
Your Personal Tour Guide
Ask me questions while you tour the home.