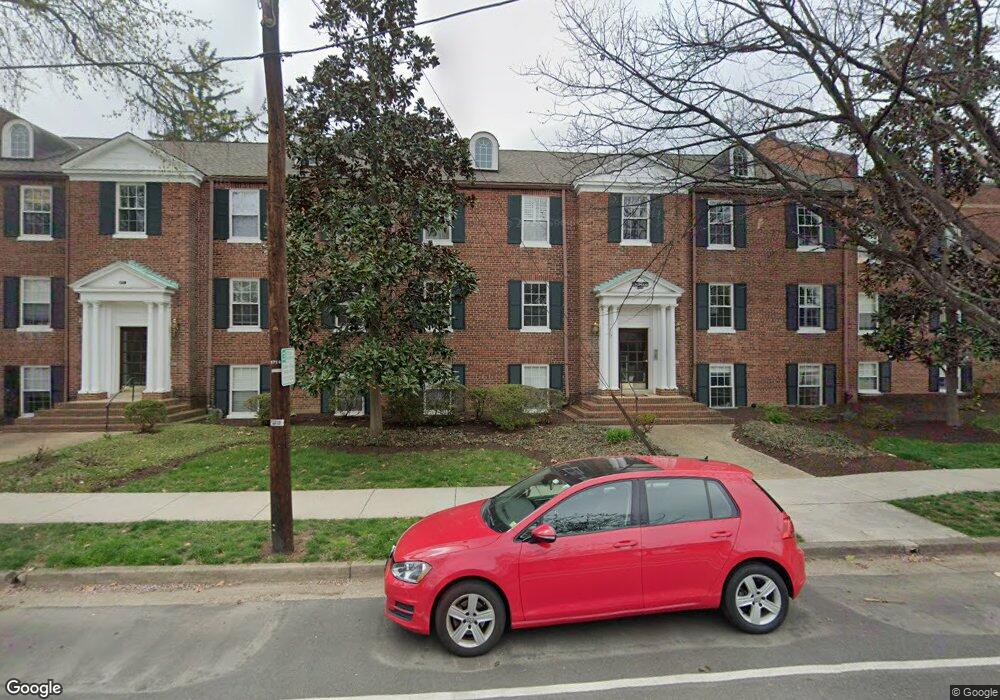
400 Commonwealth Ave Unit 101 Alexandria, VA 22301
Rosemont NeighborhoodEstimated Value: $430,000 - $475,000
2
Beds
1
Bath
965
Sq Ft
$473/Sq Ft
Est. Value
About This Home
This home is located at 400 Commonwealth Ave Unit 101, Alexandria, VA 22301 and is currently estimated at $456,605, approximately $473 per square foot. 400 Commonwealth Ave Unit 101 is a home located in Alexandria City with nearby schools including Naomi L. Brooks Elementary School, George Washington Middle School, and Alexandria City High School.
Ownership History
Date
Name
Owned For
Owner Type
Purchase Details
Closed on
May 17, 2024
Sold by
Lundstrom Thomas J
Bought by
Christiansen Dane R
Current Estimated Value
Home Financials for this Owner
Home Financials are based on the most recent Mortgage that was taken out on this home.
Original Mortgage
$409,500
Outstanding Balance
$403,692
Interest Rate
6.82%
Mortgage Type
New Conventional
Estimated Equity
$52,913
Purchase Details
Closed on
Apr 13, 2006
Sold by
Domar Partners L L C
Bought by
Lundstrom Thomas J
Home Financials for this Owner
Home Financials are based on the most recent Mortgage that was taken out on this home.
Original Mortgage
$77,600
Interest Rate
8.63%
Mortgage Type
New Conventional
Create a Home Valuation Report for This Property
The Home Valuation Report is an in-depth analysis detailing your home's value as well as a comparison with similar homes in the area
Home Values in the Area
Average Home Value in this Area
Purchase History
| Date | Buyer | Sale Price | Title Company |
|---|---|---|---|
| Christiansen Dane R | $455,000 | Westcor Land Title | |
| Lundstrom Thomas J | $388,000 | -- |
Source: Public Records
Mortgage History
| Date | Status | Borrower | Loan Amount |
|---|---|---|---|
| Open | Christiansen Dane R | $409,500 | |
| Previous Owner | Lundstrom Thomas J | $77,600 | |
| Previous Owner | Lundstrom Thomas J | $310,400 |
Source: Public Records
Tax History Compared to Growth
Tax History
| Year | Tax Paid | Tax Assessment Tax Assessment Total Assessment is a certain percentage of the fair market value that is determined by local assessors to be the total taxable value of land and additions on the property. | Land | Improvement |
|---|---|---|---|---|
| 2025 | $3,606 | $309,945 | $162,981 | $146,964 |
| 2024 | $3,606 | $309,945 | $162,981 | $146,964 |
| 2023 | $3,440 | $309,945 | $162,981 | $146,964 |
| 2022 | $3,301 | $297,417 | $156,977 | $140,440 |
| 2021 | $3,301 | $297,417 | $156,977 | $140,440 |
| 2020 | $3,320 | $297,417 | $156,977 | $140,440 |
| 2019 | $3,201 | $283,255 | $149,502 | $133,753 |
| 2018 | $3,138 | $277,700 | $146,570 | $131,130 |
| 2017 | $3,138 | $277,700 | $146,570 | $131,130 |
| 2016 | $2,838 | $264,476 | $139,590 | $124,886 |
| 2015 | $2,935 | $281,357 | $148,500 | $132,857 |
| 2014 | $2,935 | $281,357 | $148,500 | $132,857 |
Source: Public Records
Map
Nearby Homes
- 400 Commonwealth Ave Unit 307
- 11 E Linden St
- 206 N View Terrace
- 106 E Braddock Rd
- 15 W Spring St
- 605 Hilltop Terrace
- 607 W View Terrace
- 1600 Prince St Unit 102
- 318 N Payne St
- 115 N West St
- 521 N Payne St
- 125 N West St
- 1324 Cameron St
- 107 N W
- 309 Holland Ln Unit 126
- 130 Roberts Ln Unit 201
- 130 Roberts Ln Unit 200
- 102 Roberts Ln Unit 100
- 126 Roberts Ln Unit 101
- 1312 King St Unit 210
- 400 Commonwealth Ave Unit 301
- 400 Commonwealth Ave Unit 107
- 400 Commonwealth Ave Unit 104
- 400 Commonwealth Ave Unit 102
- 400 Commonwealth Ave Unit 207
- 400 Commonwealth Ave Unit 103
- 400 Commonwealth Ave Unit 202
- 400 Commonwealth Ave Unit 203
- 400 Commonwealth Ave Unit 304
- 400 Commonwealth Ave Unit 204
- 400 Commonwealth Ave Unit 308
- 400 Commonwealth Ave Unit 305
- 400 Commonwealth Ave Unit 302
- 400 Commonwealth Ave Unit 206
- 400 Commonwealth Ave Unit 205
- 400 Commonwealth Ave Unit 201
- 400 Commonwealth Ave Unit 108
- 400 Commonwealth Ave Unit 106
- 400 Commonwealth Ave Unit 105