
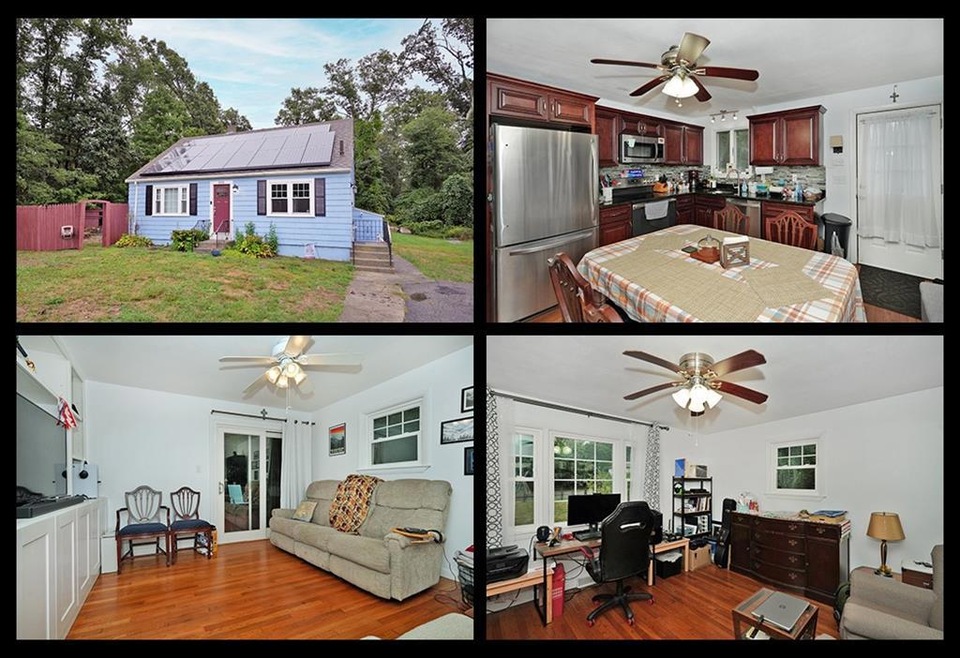
400 Crandall Rd Tiverton, RI 02878
Bliss Corners Neighborhood
3
Beds
1
Bath
1,386
Sq Ft
0.26
Acres
Highlights
- Solar Power System
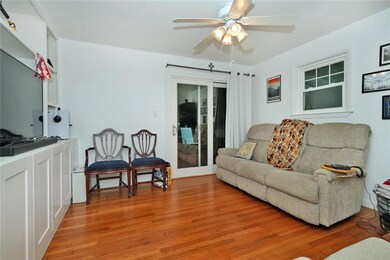
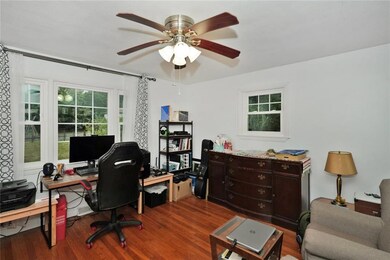
- Wood Flooring
- Recreation Facilities
- Cape Cod Architecture
- Attic
- Thermal Windows
About This Home
As of December 2022Estimated Payment $1,789 Per Month. * 20% Down 30-Year fixed mortgage rate of 5.95% with an APR of 5.97% to those who qualify. * Taxes insurance not included. * Rates As of 09/06/22. * Optional 13-month limited home warranty included from HWA Home Warranty limited to components/structure.
__________________________________________________________________________________________________________
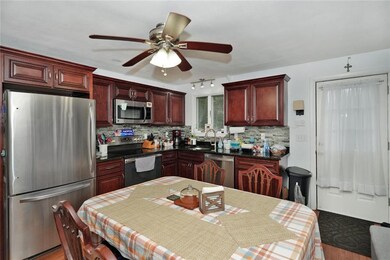
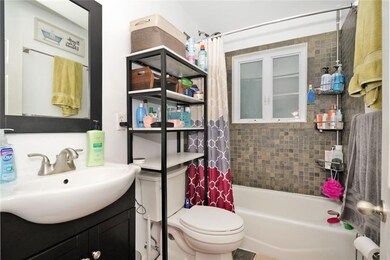
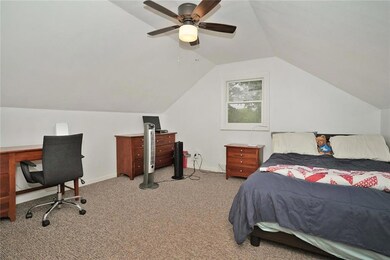
Meticulous home fully renovated and including a gigantic granite/ stainless kitchen, newly updated tile bathroom, gleaming hardwood flooring, formal dining area, vinyl windows, and beautiful built-in cabinets. it is located in a highly desirable area and sits on over a 1/4 acre with huge yard and a newer roof. The solar panels on the home are PAID IN FULL so you can enjoy your electric savings immediately!!!
Home Details
Home Type
- Single Family
Est. Annual Taxes
- $3,586
Year Built
- Built in 1960
Home Design
- Cape Cod Architecture
- Shingle Siding
- Concrete Perimeter Foundation
Interior Spaces
- 1,386 Sq Ft Home
- 2-Story Property
- Thermal Windows
- Wood Flooring
- Attic
Kitchen
- Oven
- Range
- Dishwasher
Bedrooms and Bathrooms
- 3 Bedrooms
- 1 Full Bathroom
- Bathtub with Shower
Laundry
- Dryer
- Washer
Unfinished Basement
- Basement Fills Entire Space Under The House
- Interior and Exterior Basement Entry
Parking
- 6 Parking Spaces
- No Garage
Utilities
- No Cooling
- Forced Air Heating System
- Heating System Uses Oil
- 100 Amp Service
- Well
- Electric Water Heater
- Septic Tank
- Cable TV Available
Additional Features
- Solar Power System
- 0.26 Acre Lot
Listing and Financial Details
- Tax Lot 230
- Assessor Parcel Number 400CRANDALLRDTIVR
Community Details
Amenities
- Shops
Recreation
- Recreation Facilities
Ownership History
Date
Name
Owned For
Owner Type
Purchase Details
Listed on
Sep 6, 2022
Closed on
Dec 9, 2022
Sold by
Meriano Meghan
Bought by
Chestnut Brenton D and Labrador Hillary
Seller's Agent
Nathan Clark
Your Home Sold Guaranteed, NCT
Buyer's Agent
Matthew Romano
HomeSmart Professionals
List Price
$374,900
Sold Price
$383,500
Premium/Discount to List
$8,600
2.29%
Views
185
Current Estimated Value
Home Financials for this Owner
Home Financials are based on the most recent Mortgage that was taken out on this home.
Estimated Appreciation
$76,670
Avg. Annual Appreciation
5.85%
Original Mortgage
$364,325
Outstanding Balance
$354,358
Interest Rate
7.08%
Mortgage Type
Purchase Money Mortgage
Estimated Equity
$93,535
Purchase Details
Listed on
Oct 8, 2020
Closed on
Jan 22, 2021
Sold by
Vecchione Anthony and Vecchione Shannon K
Bought by
Meriano Meghan
Seller's Agent
Lindsey Duckworth
Mott & Chace Sotheby's Intl.
Buyer's Agent
Edward Izeman
Coldwell Banker Realty
List Price
$349,000
Sold Price
$330,000
Premium/Discount to List
-$19,000
-5.44%
Home Financials for this Owner
Home Financials are based on the most recent Mortgage that was taken out on this home.
Avg. Annual Appreciation
8.32%
Original Mortgage
$337,590
Interest Rate
2.71%
Mortgage Type
FHA
Purchase Details
Listed on
May 4, 2016
Closed on
Sep 19, 2016
Sold by
Goldstein Samson A
Bought by
Vecchione Anthony and Vecchione Shannon K
Seller's Agent
Matthew Bissonnette
Riverside Realty
Buyer's Agent
Lisa Matos
Envision Real Estate, Inc.
List Price
$244,999
Sold Price
$250,000
Premium/Discount to List
$5,001
2.04%
Home Financials for this Owner
Home Financials are based on the most recent Mortgage that was taken out on this home.
Avg. Annual Appreciation
6.59%
Original Mortgage
$200,000
Interest Rate
3.43%
Mortgage Type
New Conventional
Purchase Details
Listed on
Feb 27, 2012
Closed on
Apr 27, 2012
Sold by
Fnma
Bought by
Goldstein Samson A
Seller's Agent
Chuck Spencer
Hogan Associates Christie's
Buyer's Agent
Non-Mls Member
Non-Mls Member
List Price
$104,500
Sold Price
$104,900
Premium/Discount to List
$400
0.38%
Home Financials for this Owner
Home Financials are based on the most recent Mortgage that was taken out on this home.
Avg. Annual Appreciation
21.82%
Purchase Details
Listed on
Feb 27, 2012
Closed on
Feb 28, 2012
Sold by
Lachapelle Kimberly and Lachapelle John
Bought by
Federal National Mortgage Association
Seller's Agent
Chuck Spencer
Hogan Associates Christie's
Buyer's Agent
Non-Mls Member
Non-Mls Member
List Price
$104,500
Sold Price
$104,900
Premium/Discount to List
$400
0.38%
Similar Homes in the area
Create a Home Valuation Report for This Property
The Home Valuation Report is an in-depth analysis detailing your home's value as well as a comparison with similar homes in the area
Home Values in the Area
Average Home Value in this Area
Purchase History
| Date | Type | Sale Price | Title Company |
|---|---|---|---|
| Warranty Deed | $383,500 | None Available | |
| Warranty Deed | $330,000 | None Available | |
| Warranty Deed | $250,000 | -- | |
| Not Resolvable | $104,900 | -- | |
| Quit Claim Deed | -- | -- |
Source: Public Records
Mortgage History
| Date | Status | Loan Amount | Loan Type |
|---|---|---|---|
| Open | $364,325 | Purchase Money Mortgage | |
| Previous Owner | $337,590 | FHA | |
| Previous Owner | $200,000 | New Conventional | |
| Previous Owner | $93,000 | No Value Available | |
| Previous Owner | $152,000 | No Value Available | |
| Previous Owner | $144,000 | No Value Available |
Source: Public Records
Property History
| Date | Event | Price | Change | Sq Ft Price |
|---|---|---|---|---|
| 12/09/2022 12/09/22 | Sold | $383,500 | +2.3% | $277 / Sq Ft |
| 09/06/2022 09/06/22 | For Sale | $374,900 | +13.6% | $270 / Sq Ft |
| 01/22/2021 01/22/21 | Sold | $330,000 | -5.4% | $238 / Sq Ft |
| 12/23/2020 12/23/20 | Pending | -- | -- | -- |
| 10/08/2020 10/08/20 | For Sale | $349,000 | +39.6% | $252 / Sq Ft |
| 09/19/2016 09/19/16 | Sold | $250,000 | +2.0% | $187 / Sq Ft |
| 08/11/2016 08/11/16 | Pending | -- | -- | -- |
| 06/28/2016 06/28/16 | For Sale | $244,999 | 0.0% | $183 / Sq Ft |
| 05/19/2016 05/19/16 | Pending | -- | -- | -- |
| 05/04/2016 05/04/16 | For Sale | $244,999 | +133.6% | $183 / Sq Ft |
| 04/27/2012 04/27/12 | Sold | $104,900 | +0.4% | $78 / Sq Ft |
| 03/28/2012 03/28/12 | Pending | -- | -- | -- |
| 02/27/2012 02/27/12 | For Sale | $104,500 | -- | $78 / Sq Ft |
Source: State-Wide MLS
Tax History Compared to Growth
Tax History
| Year | Tax Paid | Tax Assessment Tax Assessment Total Assessment is a certain percentage of the fair market value that is determined by local assessors to be the total taxable value of land and additions on the property. | Land | Improvement |
|---|---|---|---|---|
| 2024 | $3,919 | $354,700 | $116,000 | $238,700 |
| 2023 | $3,695 | $248,000 | $101,100 | $146,900 |
| 2022 | $3,586 | $245,100 | $101,100 | $144,000 |
| 2021 | $3,498 | $245,100 | $101,100 | $144,000 |
| 2020 | $3,376 | $208,500 | $63,800 | $144,700 |
| 2019 | $3,292 | $208,500 | $63,800 | $144,700 |
| 2018 | $3,417 | $208,500 | $63,800 | $144,700 |
| 2017 | $3,149 | $165,300 | $63,800 | $101,500 |
| 2016 | $3,164 | $165,300 | $63,800 | $101,500 |
| 2015 | $3,164 | $165,300 | $63,800 | $101,500 |
| 2014 | $2,609 | $135,200 | $63,800 | $71,400 |
Source: Public Records
Agents Affiliated with this Home
-
Nathan Clark
Seller's Agent in 2022
Nathan Clark
Your Home Sold Guaranteed, NCT
(401) 232-8301
9 in this area
2,122 Total Sales
-
Matthew Romano
Buyer's Agent in 2022
Matthew Romano
HomeSmart Professionals
(401) 743-2210
2 in this area
104 Total Sales
-
Lindsey Duckworth
Seller's Agent in 2021
Lindsey Duckworth
Mott & Chace Sotheby's Intl.
(508) 284-0158
4 in this area
87 Total Sales
-
Edward Izeman
Buyer's Agent in 2021
Edward Izeman
Coldwell Banker Realty
(401) 440-1949
1 in this area
54 Total Sales
-
Matthew Bissonnette
Seller's Agent in 2016
Matthew Bissonnette
Riverside Realty
19 Total Sales
-
L
Buyer's Agent in 2016
Lisa Matos
Envision Real Estate, Inc.
Map
Source: State-Wide MLS
MLS Number: 1319430
APN: TIVE-000515-000000-000230
Disclaimer: Certain information contained herein is derived from information provided by parties other than Homes.com. All information provided is deemed reliable, but is not guaranteed to be accurate and should be independently verified.
![]() IDX information is provided exclusively for personal, non-commercial use, and may not be used for any purpose other than to identify prospective properties consumers may be interested in purchasing. Information is deemed reliable but not guaranteed.
IDX information is provided exclusively for personal, non-commercial use, and may not be used for any purpose other than to identify prospective properties consumers may be interested in purchasing. Information is deemed reliable but not guaranteed.
Copyright © 2025 State-Wide MLS, Inc. All rights reserved.
Nearby Homes
- 380 Crandall Rd
- 16 Indian Grass Cir
- 0 Crandall Rd
- 8 Campion Ave
- 225 Brayton Ave
- 65 Knotty Pine Rd
- 33 Moniz Dr
- 2 Magnolia Ln
- 50 Tower Hill Rd
- 0 Leger Ln Unit 73361952
- 0 Leger Ln Unit 1382826
- 60 Tower Hill Rd
- 2 Lawtons Ln
- 660 Windwood Dr Unit 6
- 720 Bulgarmarsh Rd
- 46 Fairway Dr
- 27 Windsor Dr Unit 27
- 978 Sodom Rd
- 33 Newton St
- 85 Ridgeline Dr