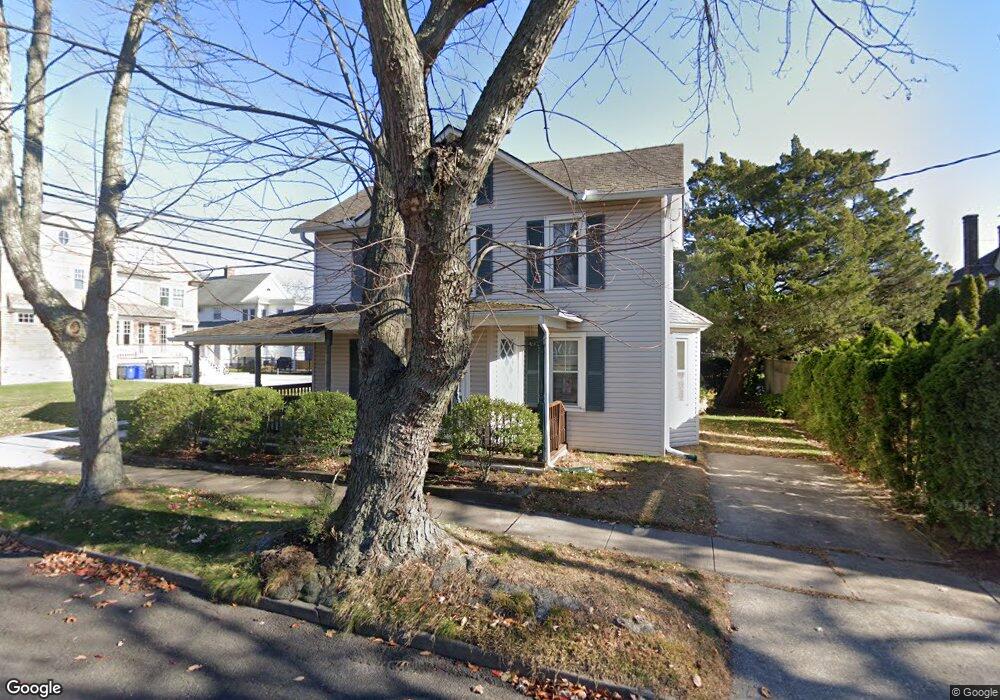
400 D St Belmar, NJ 07719
Estimated Value: $915,347 - $1,282,000
2
Beds
2
Baths
1,323
Sq Ft
$826/Sq Ft
Est. Value
About This Home
This home is located at 400 D St, Belmar, NJ 07719 and is currently estimated at $1,092,587, approximately $825 per square foot. 400 D St is a home located in Monmouth County with nearby schools including Belmar Elementary School, St. Rose Grammar School, and St Rose High School.
Ownership History
Date
Name
Owned For
Owner Type
Purchase Details
Closed on
Jan 14, 2000
Sold by
Matarazzo Ronald
Bought by
Sheridan Thea
Current Estimated Value
Home Financials for this Owner
Home Financials are based on the most recent Mortgage that was taken out on this home.
Original Mortgage
$152,000
Outstanding Balance
$48,258
Interest Rate
7.83%
Estimated Equity
$1,044,329
Purchase Details
Closed on
Jan 14, 1994
Sold by
Estate Of Edith Tooze
Bought by
Matarazzo Ronald and Gallagher Stacie
Home Financials for this Owner
Home Financials are based on the most recent Mortgage that was taken out on this home.
Original Mortgage
$100,000
Interest Rate
7.22%
Create a Home Valuation Report for This Property
The Home Valuation Report is an in-depth analysis detailing your home's value as well as a comparison with similar homes in the area
Home Values in the Area
Average Home Value in this Area
Purchase History
| Date | Buyer | Sale Price | Title Company |
|---|---|---|---|
| Sheridan Thea | $190,000 | -- | |
| Matarazzo Ronald | $112,000 | -- |
Source: Public Records
Mortgage History
| Date | Status | Borrower | Loan Amount |
|---|---|---|---|
| Open | Sheridan Thea | $152,000 | |
| Previous Owner | Matarazzo Ronald | $100,000 |
Source: Public Records
Tax History
| Year | Tax Paid | Tax Assessment Tax Assessment Total Assessment is a certain percentage of the fair market value that is determined by local assessors to be the total taxable value of land and additions on the property. | Land | Improvement |
|---|---|---|---|---|
| 2025 | $6,644 | $456,600 | $342,000 | $114,600 |
| 2024 | $6,420 | $456,600 | $342,000 | $114,600 |
Source: Public Records
Map
Nearby Homes
- 210 5th Ave Unit 25
- 201 2nd Ave Unit 4B
- 119 4th Ave
- 203 4th Ave
- 106 2nd Ave
- 303 Spinnaker Way
- 100 1st Ave
- 23 Washington Ave
- 308 Sea Spray Ln
- 371 Sea Spray Ct
- 1203 D St
- 20 Laird Way
- 22 Albany Rd
- 501 Main St Unit 40
- 113 12th Ave
- 1 Railroad Ave Unit B6
- 1 Railroad Ave Unit B4
- 1 Railroad Ave Unit C1
- 1 Railroad Ave Unit B2
- 1 Railroad Ave Unit B1