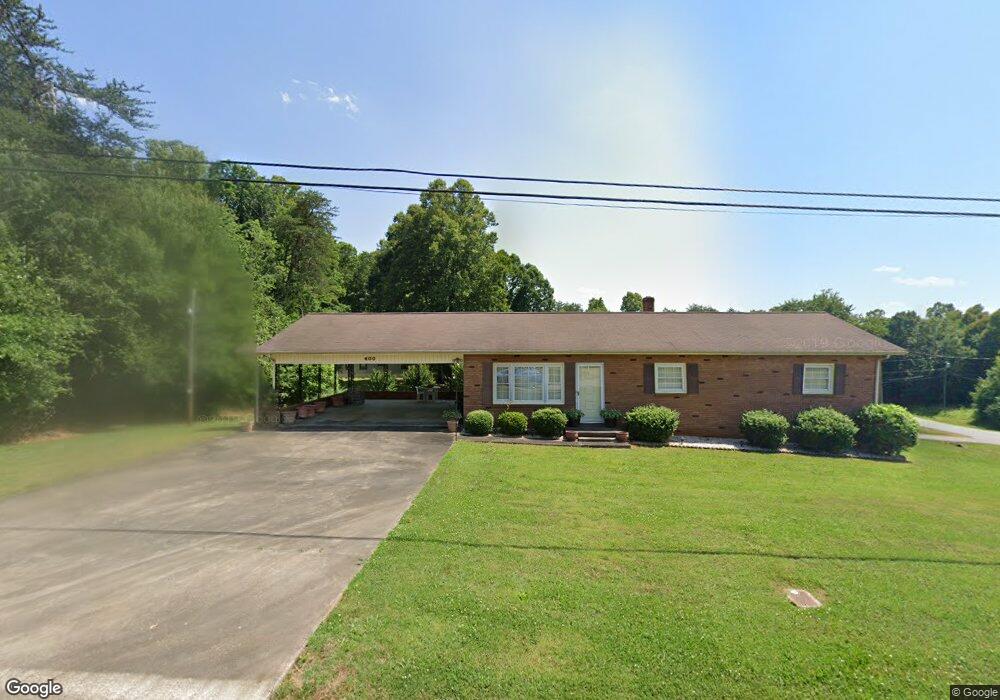
400 Drexel Rd Morganton, NC 28655
Estimated Value: $254,710 - $306,000
3
Beds
2
Baths
1,421
Sq Ft
$193/Sq Ft
Est. Value
About This Home
This home is located at 400 Drexel Rd, Morganton, NC 28655 and is currently estimated at $274,428, approximately $193 per square foot. 400 Drexel Rd is a home located in Burke County with nearby schools including Mull Elementary School, Liberty Middle School, and Robert L. Patton High School.
Ownership History
Date
Name
Owned For
Owner Type
Purchase Details
Closed on
Oct 16, 2020
Sold by
Mull Shirley K and Scott Mull Randy
Bought by
Trent Ridings Matthew
Current Estimated Value
Purchase Details
Closed on
Feb 13, 2020
Sold by
Mull Shirley K and Mull Randy Scott
Bought by
Ridings Matthew Trent
Home Financials for this Owner
Home Financials are based on the most recent Mortgage that was taken out on this home.
Original Mortgage
$140,359
Interest Rate
3.72%
Mortgage Type
New Conventional
Purchase Details
Closed on
Jan 7, 2019
Sold by
Jodway Thomas and Jodway Danielle
Bought by
Meservey Christopher Alan and Meservey Valerie Marie
Home Financials for this Owner
Home Financials are based on the most recent Mortgage that was taken out on this home.
Original Mortgage
$275,200
Interest Rate
3.6%
Mortgage Type
New Conventional
Create a Home Valuation Report for This Property
The Home Valuation Report is an in-depth analysis detailing your home's value as well as a comparison with similar homes in the area
Home Values in the Area
Average Home Value in this Area
Purchase History
| Date | Buyer | Sale Price | Title Company |
|---|---|---|---|
| Trent Ridings Matthew | -- | None Available | |
| Ridings Matthew Trent | $138,000 | None Available | |
| Meservey Christopher Alan | $344,000 | None Available |
Source: Public Records
Mortgage History
| Date | Status | Borrower | Loan Amount |
|---|---|---|---|
| Previous Owner | Ridings Matthew Trent | $140,359 | |
| Previous Owner | Meservey Christopher Alan | $275,200 |
Source: Public Records
Tax History
| Year | Tax Paid | Tax Assessment Tax Assessment Total Assessment is a certain percentage of the fair market value that is determined by local assessors to be the total taxable value of land and additions on the property. | Land | Improvement |
|---|---|---|---|---|
| 2025 | $1,373 | $195,564 | $8,755 | $186,809 |
| 2024 | $1,379 | $195,564 | $8,755 | $186,809 |
| 2023 | $1,379 | $195,564 | $8,755 | $186,809 |
| 2022 | $971 | $115,027 | $7,480 | $107,547 |
| 2021 | $965 | $115,027 | $7,480 | $107,547 |
| 2020 | $506 | $117,659 | $13,938 | $103,721 |
| 2019 | $506 | $117,659 | $13,938 | $103,721 |
| 2018 | $498 | $114,953 | $13,938 | $101,015 |
| 2017 | $497 | $114,953 | $13,938 | $101,015 |
| 2016 | $486 | $114,953 | $13,938 | $101,015 |
| 2015 | $484 | $114,953 | $13,938 | $101,015 |
| 2014 | $484 | $114,953 | $13,938 | $101,015 |
| 2013 | $484 | $114,953 | $13,938 | $101,015 |
Source: Public Records
Map
Nearby Homes
- 316 Drexel Rd
- 1438 Bethel Rd
- 3065 Woodstream Dr
- 632 Drexel Rd
- 2949 Woodwind Dr
- 2912 Woodstream Dr
- 2700 Dav Ave
- 2715 Moose Lodge St
- 731 Summers Rd
- 303 Constitution Dr
- 3151 Morganton Furniture Rd
- VL Blvd
- 2646 Mount Home Church Rd
- 3161 Morganton Furniture Rd
- 3845 Laurel Heights Dr
- 3287 Stones Throw Dr Unit 3
- 3859 Metcalf Dr
- 2491 Watts St
- 3901 & 3913 High Peak Terrace Rd
- 2986 Green Pasture Ln
- 108 Searcy St Unit 110
- 401 Drexel Rd Unit 401A
- 105 Searcy St
- 403 Drexel Rd
- 318 Drexel Rd
- 333 Drexel Rd
- 413 Drexel Rd
- 101 Hastings Dr
- 412 Drexel Rd
- 115 Searcy St
- 1506 Bethel Rd
- 105 Hastings Dr
- 1510 Bethel Rd
- 416 Drexel Rd
- 117 Searcy St
- 107 Hastings Dr
- 109 Hastings Dr
- 1616 Bethel Rd
- 1513 Bethel Rd
- 113 Hastings Dr
Your Personal Tour Guide
Ask me questions while you tour the home.