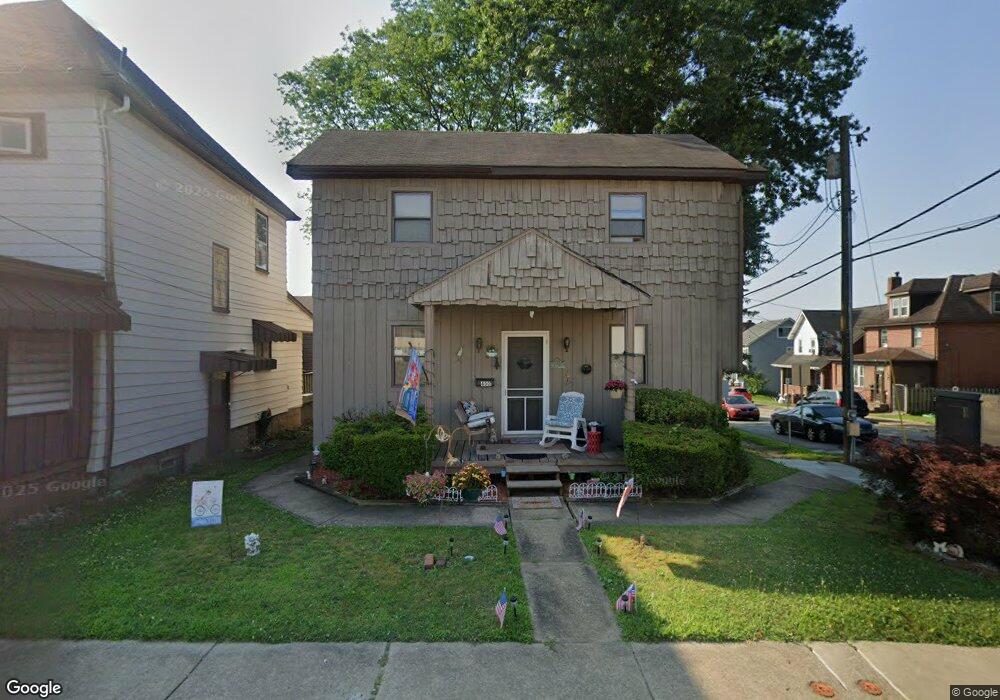
400 E 10th Ave Tarentum, PA 15084
Estimated Value: $87,000 - $95,000
2
Beds
2
Baths
1,520
Sq Ft
$61/Sq Ft
Est. Value
About This Home
This home is located at 400 E 10th Ave, Tarentum, PA 15084 and is currently estimated at $92,508, approximately $60 per square foot. 400 E 10th Ave is a home located in Allegheny County with nearby schools including Highlands Senior High School, Mary Queen of Apostles School, and St. Joseph High School.
Ownership History
Date
Name
Owned For
Owner Type
Purchase Details
Closed on
Nov 4, 2015
Sold by
Pint Christopher J and Dojonovic Thomas
Bought by
Ridge Properties Llc
Current Estimated Value
Purchase Details
Closed on
Dec 3, 2004
Sold by
Jannello Regis
Bought by
Pint Christopher
Home Financials for this Owner
Home Financials are based on the most recent Mortgage that was taken out on this home.
Original Mortgage
$67,000
Interest Rate
5.69%
Mortgage Type
New Conventional
Purchase Details
Closed on
Jun 30, 1995
Sold by
Kramarik Richard J and Kramarik Jean Ann
Bought by
Jannello Regis D
Create a Home Valuation Report for This Property
The Home Valuation Report is an in-depth analysis detailing your home's value as well as a comparison with similar homes in the area
Home Values in the Area
Average Home Value in this Area
Purchase History
| Date | Buyer | Sale Price | Title Company |
|---|---|---|---|
| Ridge Properties Llc | $51,500 | None Available | |
| Pint Christopher | $63,000 | -- | |
| Jannello Regis D | $55,000 | -- |
Source: Public Records
Mortgage History
| Date | Status | Borrower | Loan Amount |
|---|---|---|---|
| Previous Owner | Pint Christopher | $67,000 |
Source: Public Records
Tax History
| Year | Tax Paid | Tax Assessment Tax Assessment Total Assessment is a certain percentage of the fair market value that is determined by local assessors to be the total taxable value of land and additions on the property. | Land | Improvement |
|---|---|---|---|---|
| 2025 | $1,824 | $51,600 | $15,100 | $36,500 |
| 2024 | $1,824 | $51,600 | $15,100 | $36,500 |
| 2023 | $1,824 | $51,600 | $15,100 | $36,500 |
| 2022 | $1,811 | $51,600 | $15,100 | $36,500 |
| 2021 | $244 | $51,600 | $15,100 | $36,500 |
| 2020 | $1,811 | $51,600 | $15,100 | $36,500 |
| 2019 | $1,798 | $51,600 | $15,100 | $36,500 |
| 2017 | $1,755 | $51,600 | $15,100 | $36,500 |
Source: Public Records
Map
Nearby Homes
Your Personal Tour Guide
Ask me questions while you tour the home.