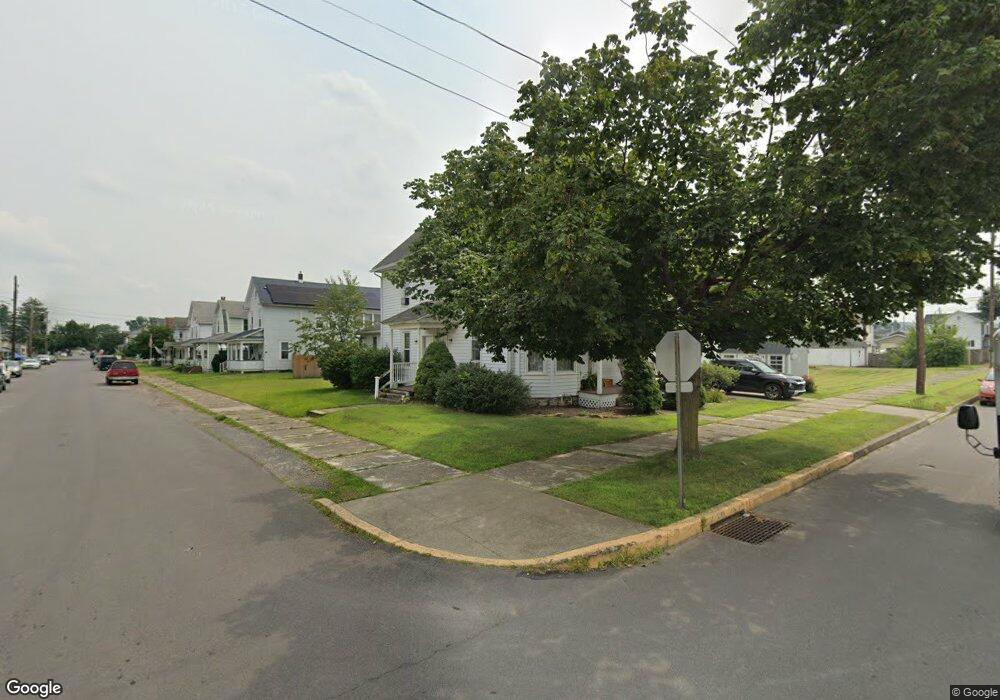
400 E 8th St Berwick, PA 18603
Estimated Value: $171,163 - $212,000
3
Beds
--
Bath
1,000
Sq Ft
$198/Sq Ft
Est. Value
About This Home
3 Bedroom unit with 1 bedroom & full bathroom on 1st floor, 2 bedrooms upstairs, basement for storage. All appliances including dishwasher, microwave, stove and refrigerator. Gas heat. Tenant pays gas, electric, water and trash. Owner pays sewer. Tenant mows grass and shovels sidewalks. Large yard. Broker-owned.
Ownership History
Date
Name
Owned For
Owner Type
Purchase Details
Closed on
May 28, 2003
Bought by
Sorge Sandro M and Sorge Christine W
Current Estimated Value
Create a Home Valuation Report for This Property
The Home Valuation Report is an in-depth analysis detailing your home's value as well as a comparison with similar homes in the area
Home Values in the Area
Average Home Value in this Area
Purchase History
| Date | Buyer | Sale Price | Title Company |
|---|---|---|---|
| Sorge Sandro M | $50,000 | -- |
Source: Public Records
Property History
| Date | Event | Price | List to Sale | Price per Sq Ft |
|---|---|---|---|---|
| 04/04/2025 04/04/25 | Off Market | $900 | -- | -- |
| 03/20/2025 03/20/25 | For Rent | $900 | 0.0% | -- |
| 03/11/2025 03/11/25 | Off Market | $900 | -- | -- |
| 02/10/2025 02/10/25 | Off Market | -- | -- | -- |
| 02/05/2025 02/05/25 | For Rent | $900 | -- | -- |
| 02/05/2025 02/05/25 | For Rent | -- | -- | -- |
Tax History
| Year | Tax Paid | Tax Assessment Tax Assessment Total Assessment is a certain percentage of the fair market value that is determined by local assessors to be the total taxable value of land and additions on the property. | Land | Improvement |
|---|---|---|---|---|
| 2025 | $2,642 | $29,468 | $0 | $0 |
| 2024 | $2,612 | $29,468 | $6,600 | $22,868 |
| 2023 | $2,435 | $29,468 | $6,600 | $22,868 |
| 2022 | $2,355 | $29,468 | $6,600 | $22,868 |
| 2021 | $2,303 | $29,468 | $6,600 | $22,868 |
| 2020 | $2,251 | $29,468 | $6,600 | $22,868 |
| 2019 | $2,216 | $29,468 | $6,600 | $22,868 |
| 2018 | $2,128 | $29,468 | $6,600 | $22,868 |
| 2017 | $2,135 | $29,468 | $6,600 | $22,868 |
| 2016 | -- | $29,468 | $6,600 | $22,868 |
| 2015 | -- | $29,468 | $6,600 | $22,868 |
| 2014 | -- | $29,468 | $6,600 | $22,868 |
Source: Public Records
Map
Nearby Homes
- 401 E 6th St
- 310 E 6th St
- 435 E 10th St
- 229 E 5th St
- 1108 Walnut St
- LOT 11,320 E 13th St
- 204 206 E 10 St
- 600 E 10th St
- 609 E 8th St
- 1006 Pine St
- 114 E 7th St
- LOT 5, 320 E 13th St
- 417 E Front St
- 539 E 2nd St
- 1308 Chestnut St
- 1201 N Market St
- 911 N Mulberry St
- 340 N Mulberry St
- 239 E 15th St
- 1333 7th Ave