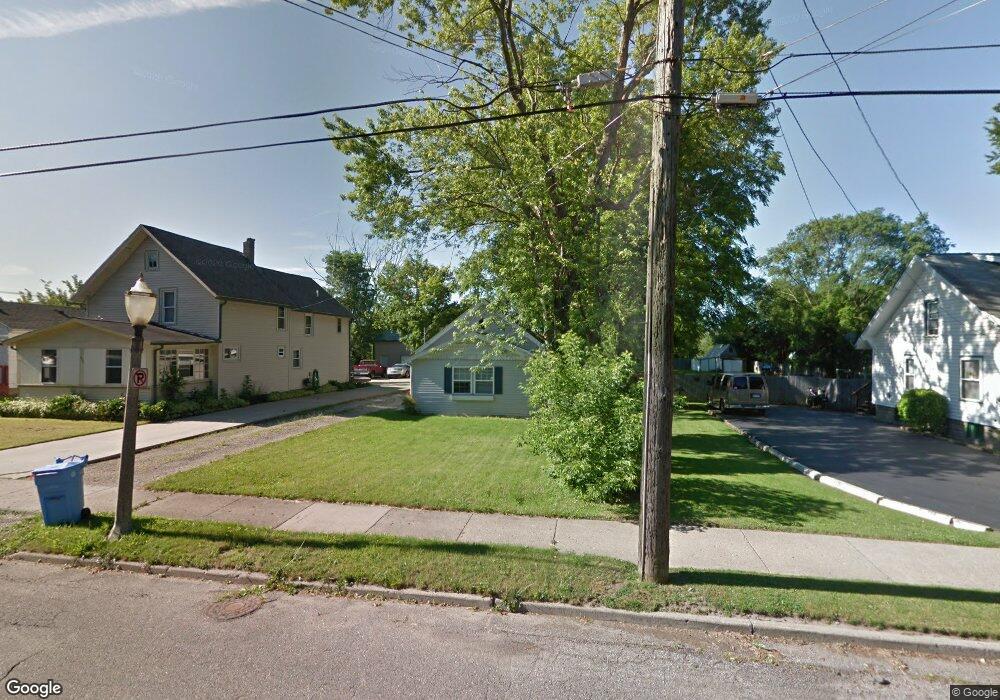
400 E Hodge Ave Lansing, MI 48910
Old Everett NeighborhoodEstimated Value: $80,000 - $126,000
2
Beds
1
Bath
564
Sq Ft
$182/Sq Ft
Est. Value
About This Home
This home is located at 400 E Hodge Ave, Lansing, MI 48910 and is currently estimated at $102,667, approximately $182 per square foot. 400 E Hodge Ave is a home located in Ingham County with nearby schools including Kendon School, Attwood School, and Everett High School.
Ownership History
Date
Name
Owned For
Owner Type
Purchase Details
Closed on
Jun 8, 2021
Sold by
Kite Aaron and Kite Aarn T
Bought by
Legba Enterprises Llc
Current Estimated Value
Home Financials for this Owner
Home Financials are based on the most recent Mortgage that was taken out on this home.
Original Mortgage
$625,499
Outstanding Balance
$566,311
Interest Rate
2.9%
Mortgage Type
Future Advance Clause Open End Mortgage
Estimated Equity
-$463,644
Purchase Details
Closed on
Aug 7, 2014
Sold by
Schertzing Eric
Bought by
Kite Aaron
Purchase Details
Closed on
Jun 6, 2003
Sold by
Smith Donald and Smith Matalie Bohdana
Bought by
Rowe Keith M
Home Financials for this Owner
Home Financials are based on the most recent Mortgage that was taken out on this home.
Original Mortgage
$73,841
Interest Rate
5.47%
Mortgage Type
FHA
Purchase Details
Closed on
Mar 25, 2002
Sold by
Pendell Wellington
Bought by
Smith Donald
Purchase Details
Closed on
Nov 24, 1999
Sold by
March Stephen P and March Steven
Bought by
Pendell Wellington
Purchase Details
Closed on
Nov 23, 1998
Bought by
March Steve
Create a Home Valuation Report for This Property
The Home Valuation Report is an in-depth analysis detailing your home's value as well as a comparison with similar homes in the area
Home Values in the Area
Average Home Value in this Area
Purchase History
We collect this data history from publicly available records. To have your information removed, we recommend requesting removal directly through your county’s website.
| Date | Buyer | Sale Price | Title Company |
|---|---|---|---|
| Legba Enterprises Llc | $781,874 | Liberty Title | |
| Kite Aaron | $13,000 | None Available | |
| Rowe Keith M | $75,000 | Chicago Title | |
| Smith Donald | $19,900 | -- | |
| Pendell Wellington | $12,000 | Midstate Title Company | |
| March Steve | $7,000 | -- |
Source: Public Records
Mortgage History
We collect this data history from publicly available records. To have your information removed, we recommend requesting removal directly through your county’s website.
| Date | Status | Borrower | Loan Amount |
|---|---|---|---|
| Open | Legba Enterprises Llc | $625,499 | |
| Previous Owner | Rowe Keith M | $73,841 |
Source: Public Records
Tax History
| Year | Tax Paid | Tax Assessment Tax Assessment Total Assessment is a certain percentage of the fair market value that is determined by local assessors to be the total taxable value of land and additions on the property. | Land | Improvement |
|---|---|---|---|---|
| 2025 | $2,648 | $41,700 | $5,400 | $36,300 |
| 2024 | $22 | $35,300 | $5,400 | $29,900 |
| 2023 | $2,492 | $29,900 | $5,400 | $24,500 |
| 2022 | $2,276 | $28,300 | $6,300 | $22,000 |
| 2021 | $1,705 | $25,200 | $4,300 | $20,900 |
| 2020 | $1,693 | $22,900 | $4,300 | $18,600 |
| 2019 | $1,634 | $21,500 | $4,300 | $17,200 |
| 2018 | $1,551 | $20,400 | $4,300 | $16,100 |
| 2017 | $1,492 | $20,400 | $4,300 | $16,100 |
| 2016 | $2,612 | $19,500 | $4,300 | $15,200 |
| 2015 | $2,612 | $18,900 | $8,635 | $10,265 |
| 2014 | $2,612 | $18,400 | $6,044 | $12,356 |
Source: Public Records
Map
Nearby Homes
- 413 E Hodge Ave
- 320 E Hodge Ave
- 546 Hamilton Ave
- 3318 S Cedar St
- 3319 Jewell Ave
- 2609 Maplewood Ave
- 318 E Greenlawn Ave
- 108 Dunlap St
- 2600 Maplewood Ave
- 210 Dunlap St
- 204 W Berry Ave
- 609 S Park Blvd
- 3115 Tenny St
- 2501 S Cedar St
- 3129 Cedarbrook Ave
- 226 Dunlap St
- 211 W Berry Ave
- 630 E Greenlawn Ave
- 617 Vernon Ave
- 200 Rita St
- 407 E Hodge Ave
- 405 E Hodge Ave
- 403 E Hodge Ave
- 333 E Hodge Ave
- 410 Paris Ave
- 3010 S Cedar St
- 404 Paris Ave
- 331 E Hodge Ave
- 400 Paris Ave
- 332 Paris Ave
- 323 E Hodge Ave
- 328 Paris Ave
- 410 E Hodge Ave
- 406 E Hodge Ave
- 3104 S Cedar St
- 330 E Hodge Ave
- 326 Paris Ave
- 319 E Hodge Ave
- 326 E Hodge Ave
- 320 Paris Ave
Your Personal Tour Guide
Ask me questions while you tour the home.