Estimated Value: $73,000 - $105,000
3
Beds
1
Bath
1,064
Sq Ft
$86/Sq Ft
Est. Value
About This Home
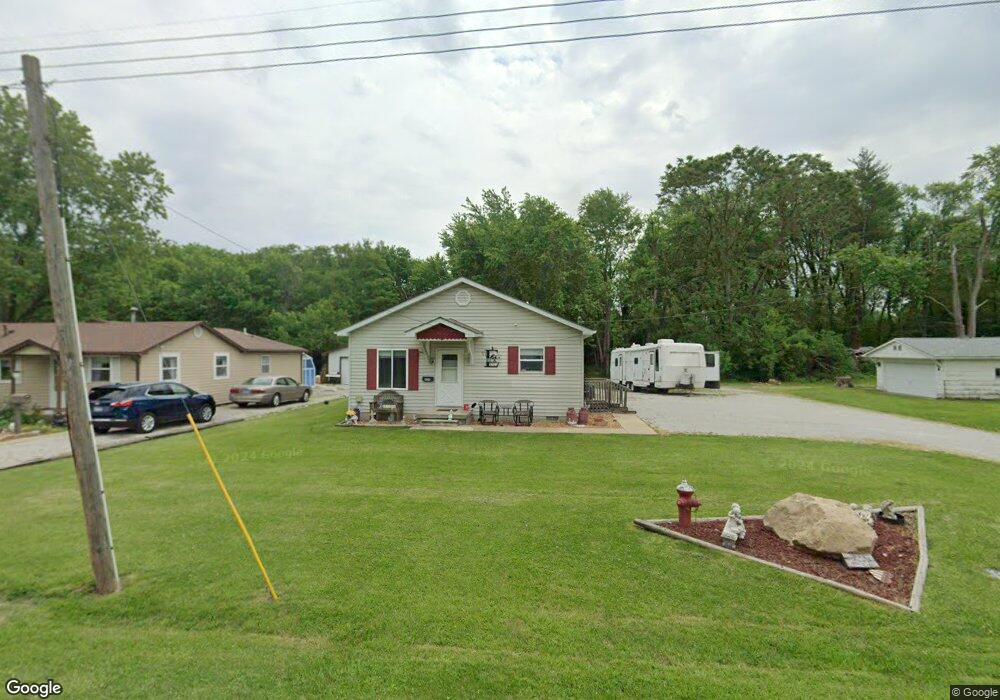
This home is located at 400 Elm St, Pana, IL 62557 and is currently estimated at $91,101, approximately $85 per square foot. 400 Elm St is a home located in Christian County with nearby schools including Washington Elementary School, Lincoln Elementary School, and Pana Jr High School.
Ownership History
Date
Name
Owned For
Owner Type
Purchase Details
Closed on
May 26, 2021
Sold by
Morris L Fringert T
Bought by
Eck Brian J and Eck Kara
Current Estimated Value
Home Financials for this Owner
Home Financials are based on the most recent Mortgage that was taken out on this home.
Original Mortgage
$75,000
Outstanding Balance
$68,009
Interest Rate
3%
Mortgage Type
Purchase Money Mortgage
Estimated Equity
$23,092
Purchase Details
Closed on
May 15, 2015
Bought by
Law Nicholas D and Law Crystal L
Purchase Details
Closed on
Apr 3, 2009
Sold by
Kull Mark E and Kull Jacqueline M
Bought by
Law Nicholas D and Law Crystal L
Home Financials for this Owner
Home Financials are based on the most recent Mortgage that was taken out on this home.
Original Mortgage
$59,000
Interest Rate
5.11%
Mortgage Type
New Conventional
Create a Home Valuation Report for This Property
The Home Valuation Report is an in-depth analysis detailing your home's value as well as a comparison with similar homes in the area
Home Values in the Area
Average Home Value in this Area
Purchase History
| Date | Buyer | Sale Price | Title Company |
|---|---|---|---|
| Eck Brian J | $75,500 | None Available | |
| Law Nicholas D | $27,500 | -- | |
| Law Nicholas D | $55,000 | None Available |
Source: Public Records
Mortgage History
| Date | Status | Borrower | Loan Amount |
|---|---|---|---|
| Open | Eck Brian J | $75,000 | |
| Previous Owner | Law Nicholas D | $59,000 |
Source: Public Records
Tax History Compared to Growth
Tax History
| Year | Tax Paid | Tax Assessment Tax Assessment Total Assessment is a certain percentage of the fair market value that is determined by local assessors to be the total taxable value of land and additions on the property. | Land | Improvement |
|---|---|---|---|---|
| 2024 | $1,599 | $22,459 | $1,728 | $20,731 |
| 2023 | $1,502 | $21,220 | $1,633 | $19,587 |
| 2022 | $1,499 | $20,609 | $1,624 | $18,985 |
| 2021 | $2,069 | $20,205 | $1,592 | $18,613 |
| 2020 | $2,014 | $19,347 | $1,524 | $17,823 |
| 2019 | $2,027 | $19,803 | $1,560 | $18,243 |
| 2018 | $1,991 | $19,524 | $1,476 | $18,048 |
| 2017 | $2,004 | $19,922 | $1,506 | $18,416 |
| 2016 | $1,982 | $19,867 | $1,502 | $18,365 |
| 2015 | $2,046 | $20,295 | $1,534 | $18,761 |
| 2014 | $1,381 | $18,877 | $1,427 | $17,450 |
| 2013 | $1,384 | $19,638 | $1,426 | $18,212 |
| 2011 | $1,376 | $20,103 | $1,460 | $18,643 |
Source: Public Records
Map
Nearby Homes