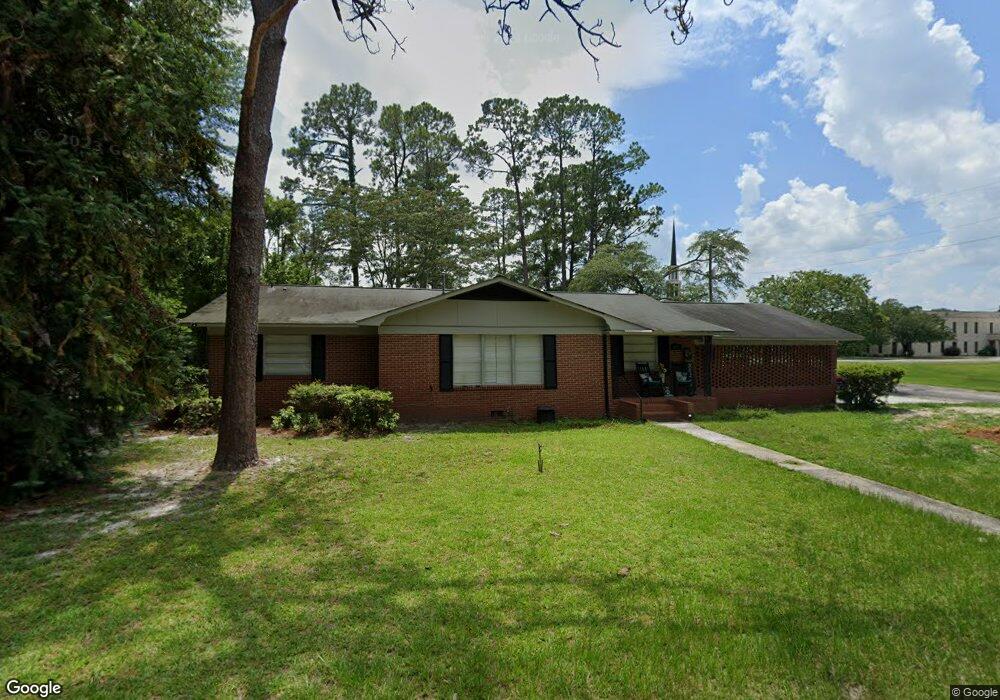
400 Forest Ave Waycross, GA 31501
Estimated Value: $172,463 - $191,000
3
Beds
2
Baths
1,571
Sq Ft
$117/Sq Ft
Est. Value
About This Home
This home is located at 400 Forest Ave, Waycross, GA 31501 and is currently estimated at $183,616, approximately $116 per square foot. 400 Forest Ave is a home located in Ware County with nearby schools including Williams Heights Elementary School, Waycross Middle School, and Ware County High School.
Ownership History
Date
Name
Owned For
Owner Type
Purchase Details
Closed on
May 12, 2020
Sold by
Hosack Melissa Anne
Bought by
Robertson Danielle
Current Estimated Value
Home Financials for this Owner
Home Financials are based on the most recent Mortgage that was taken out on this home.
Original Mortgage
$96,224
Outstanding Balance
$85,586
Interest Rate
3.5%
Mortgage Type
FHA
Estimated Equity
$98,030
Purchase Details
Closed on
Dec 14, 2017
Sold by
Vaughan Richard Hayden
Bought by
Hosack Melissa Anne
Purchase Details
Closed on
Feb 23, 2011
Sold by
Wright Marianne Vaughan and Thornton Martha Vaughan
Bought by
Vaughan Richard H
Purchase Details
Closed on
Jan 12, 2011
Sold by
Vaughan Mittie Kathleen
Bought by
Vaughan Richard H
Purchase Details
Closed on
Mar 10, 2009
Sold by
Vaughan Kathleen
Bought by
Vaughan Richard
Purchase Details
Closed on
Sep 27, 1990
Bought by
Kathleen Vaughan
Create a Home Valuation Report for This Property
The Home Valuation Report is an in-depth analysis detailing your home's value as well as a comparison with similar homes in the area
Home Values in the Area
Average Home Value in this Area
Purchase History
| Date | Buyer | Sale Price | Title Company |
|---|---|---|---|
| Robertson Danielle | $98,000 | -- | |
| Hosack Melissa Anne | $133,358 | -- | |
| Vaughan Richard H | -- | -- | |
| Vaughan Richard H | -- | -- | |
| Vaughan Richard | -- | -- | |
| Kathleen Vaughan | $50,000 | -- |
Source: Public Records
Mortgage History
| Date | Status | Borrower | Loan Amount |
|---|---|---|---|
| Open | Robertson Danielle | $96,224 |
Source: Public Records
Tax History Compared to Growth
Tax History
| Year | Tax Paid | Tax Assessment Tax Assessment Total Assessment is a certain percentage of the fair market value that is determined by local assessors to be the total taxable value of land and additions on the property. | Land | Improvement |
|---|---|---|---|---|
| 2024 | $2,426 | $61,090 | $4,000 | $57,090 |
| 2023 | $2,107 | $49,212 | $3,251 | $45,961 |
| 2022 | $1,961 | $49,212 | $3,251 | $45,961 |
| 2021 | $1,695 | $40,883 | $3,251 | $37,632 |
| 2020 | $1,547 | $35,501 | $3,251 | $32,250 |
| 2019 | $1,520 | $34,379 | $3,251 | $31,128 |
| 2018 | $1,484 | $33,258 | $3,251 | $30,007 |
| 2017 | $1,450 | $33,258 | $3,251 | $30,007 |
| 2016 | $1,450 | $33,258 | $3,251 | $30,007 |
| 2015 | $1,460 | $33,257 | $3,251 | $30,007 |
| 2014 | $1,459 | $33,258 | $3,251 | $30,007 |
| 2013 | -- | $31,989 | $3,250 | $28,738 |
Source: Public Records
Map
Nearby Homes
- 807 College St
- 1004 Hill St
- 506 Magnolia Dr
- 1101 Cherokee Dr
- 415 Dewey St
- 808 Satilla Blvd
- 502 Dewey St
- 1405 Grove Ave
- 713 Magnolia Dr
- 707 Euclid Ave
- 301 Riverside Dr
- 0 Saint Marys Dr Unit (TRACT 2 0.25 ACRES)
- .22 Alice St
- 310 Butler St
- 1500 Saint Marys Dr
- 1701 Satilla Blvd
- 903 Atlantic Ave
- 706 Cherokee Cir
- 1504 Habersham Dr
- 907 Euclid Ave