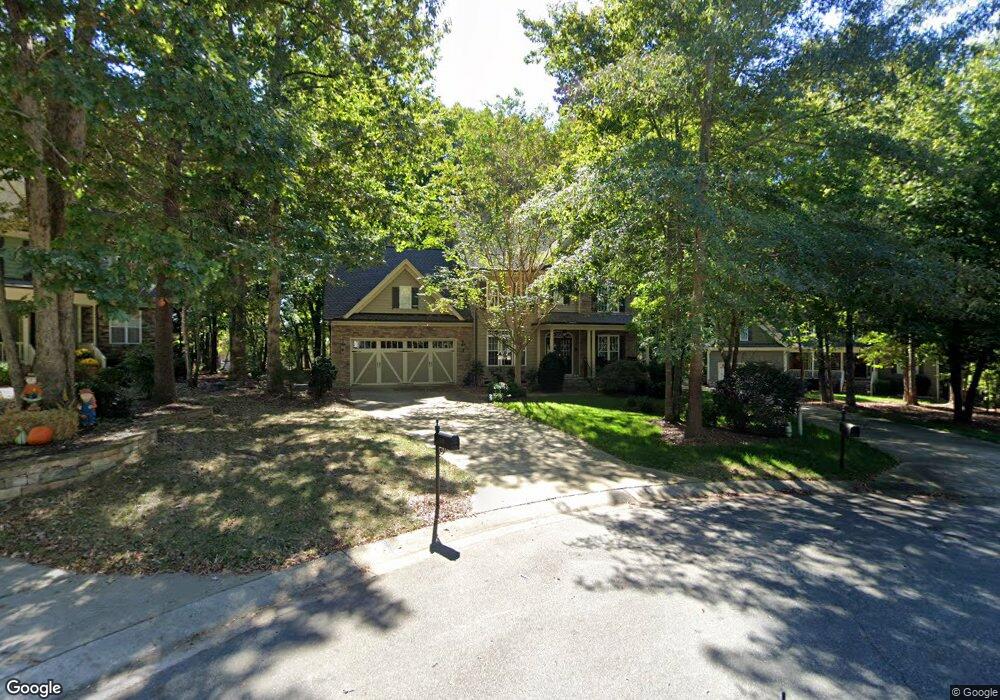
400 Gambit Cir Wake Forest, NC 27587
Estimated Value: $576,087 - $630,000
4
Beds
3
Baths
3,013
Sq Ft
$199/Sq Ft
Est. Value
About This Home
This home is located at 400 Gambit Cir, Wake Forest, NC 27587 and is currently estimated at $600,772, approximately $199 per square foot. 400 Gambit Cir is a home located in Wake County with nearby schools including Richland Creek Elementary School, Wake Forest-Rolesville Middle School, and Wake Forest High School.
Ownership History
Date
Name
Owned For
Owner Type
Purchase Details
Closed on
Sep 7, 2017
Sold by
Otlin Bradley K and Otlin Jennifer L
Bought by
Fitzpatrick Michael S and Fitzpatrick Jessica L
Current Estimated Value
Home Financials for this Owner
Home Financials are based on the most recent Mortgage that was taken out on this home.
Original Mortgage
$302,000
Outstanding Balance
$252,394
Interest Rate
3.93%
Mortgage Type
New Conventional
Estimated Equity
$348,378
Purchase Details
Closed on
Aug 3, 2007
Sold by
H J Morris Construction Inc
Bought by
Otlin Bradley K and Otlin Jennifer L
Home Financials for this Owner
Home Financials are based on the most recent Mortgage that was taken out on this home.
Original Mortgage
$284,295
Interest Rate
6.65%
Mortgage Type
Purchase Money Mortgage
Purchase Details
Closed on
Oct 26, 2006
Sold by
Contentnea Creek Development Co
Bought by
Hj Morris Construction Inc
Create a Home Valuation Report for This Property
The Home Valuation Report is an in-depth analysis detailing your home's value as well as a comparison with similar homes in the area
Home Values in the Area
Average Home Value in this Area
Purchase History
| Date | Buyer | Sale Price | Title Company |
|---|---|---|---|
| Fitzpatrick Michael S | $395,000 | None Available | |
| Otlin Bradley K | $370,500 | None Available | |
| Hj Morris Construction Inc | $170,000 | None Available |
Source: Public Records
Mortgage History
| Date | Status | Borrower | Loan Amount |
|---|---|---|---|
| Open | Fitzpatrick Michael S | $302,000 | |
| Previous Owner | Otlin Bradley K | $284,295 |
Source: Public Records
Tax History
| Year | Tax Paid | Tax Assessment Tax Assessment Total Assessment is a certain percentage of the fair market value that is determined by local assessors to be the total taxable value of land and additions on the property. | Land | Improvement |
|---|---|---|---|---|
| 2025 | $5,193 | $539,123 | $130,000 | $409,123 |
| 2024 | $5,174 | $539,123 | $130,000 | $409,123 |
Source: Public Records
Map
Nearby Homes
- 520 Checkmate Cir
- 1401 Endgame Ct
- 332 Kings Glen Way
- 1329 Endgame Ct
- 501 Kings Glen Way
- 1513 Trap Ct
- 1329 Martin Creek Dr
- 504 Sun Meadow Dr
- 617 Dixon House Ct
- 1632 Sterling Lake Dr
- 1736 Fern Hollow Trail
- 621 Sun Meadow Dr
- 1709 Glazebrook Dr
- 1200 Touchstone Way
- 2001 Latham Oaks Ave
- 123 Stone Park Dr
- 1120 Sun Springs Rd
- 1121 Touchstone Way
- 1116 Sun Springs Rd
- 1112 Sun Springs Rd
- 404 Gambit Cir
- 401 Gambit Cir
- 405 Gambit Cir
- 408 Gambit Cir
- 409 Gambit Cir
- 412 Gambit Cir
- 413 Gambit Cir
- 725 Opposition Way
- 721 Opposition Way
- 717 Opposition Way
- 401 Middlegame Way
- 417 Gambit Cir
- 416 Gambit Cir
- 405 Middlegame Way
- 729 Opposition Way
- 713 Opposition Way
- 121 Shenandoah Farm Rd
- 709 Opposition Way
- 709 Opposition Way Unit 152
- 409 Middlegame Way
Your Personal Tour Guide
Ask me questions while you tour the home.