400 Ganderleigh Farm Ln Chester, MD 21619
Estimated Value: $706,000 - $1,119,000
4
Beds
2
Baths
2,195
Sq Ft
$406/Sq Ft
Est. Value
About This Home
This home is located at 400 Ganderleigh Farm Ln, Chester, MD 21619 and is currently estimated at $891,328, approximately $406 per square foot. 400 Ganderleigh Farm Ln is a home located in Queen Anne's County with nearby schools including Kent Island Elementary School, Bayside Elementary School, and Matapeake Middle School.
Ownership History
Date
Name
Owned For
Owner Type
Purchase Details
Closed on
Jan 30, 2013
Sold by
Meidt Charles E and Meidt Johnette
Bought by
Meidt Charles E
Current Estimated Value
Home Financials for this Owner
Home Financials are based on the most recent Mortgage that was taken out on this home.
Original Mortgage
$330,000
Outstanding Balance
$230,368
Interest Rate
3.38%
Mortgage Type
New Conventional
Estimated Equity
$660,960
Purchase Details
Closed on
Oct 31, 2002
Sold by
Meidt Charles E
Bought by
Meidt Charles E and Meidt Johnette
Purchase Details
Closed on
Dec 4, 1992
Sold by
Midgley Frank M and Midgley Jan
Bought by
Meidt Charles E
Home Financials for this Owner
Home Financials are based on the most recent Mortgage that was taken out on this home.
Original Mortgage
$296,000
Interest Rate
8.34%
Create a Home Valuation Report for This Property
The Home Valuation Report is an in-depth analysis detailing your home's value as well as a comparison with similar homes in the area
Home Values in the Area
Average Home Value in this Area
Purchase History
| Date | Buyer | Sale Price | Title Company |
|---|---|---|---|
| Meidt Charles E | -- | Summit Title Company | |
| Meidt Charles E | -- | -- | |
| Meidt Charles E | $370,000 | -- |
Source: Public Records
Mortgage History
| Date | Status | Borrower | Loan Amount |
|---|---|---|---|
| Open | Meidt Charles E | $330,000 | |
| Previous Owner | Meidt Charles E | $296,000 | |
| Closed | Meidt Charles E | -- |
Source: Public Records
Tax History Compared to Growth
Tax History
| Year | Tax Paid | Tax Assessment Tax Assessment Total Assessment is a certain percentage of the fair market value that is determined by local assessors to be the total taxable value of land and additions on the property. | Land | Improvement |
|---|---|---|---|---|
| 2025 | $7,766 | $818,033 | $0 | $0 |
| 2024 | $7,173 | $755,067 | $0 | $0 |
| 2023 | $6,580 | $692,100 | $519,000 | $173,100 |
| 2022 | $6,375 | $670,400 | $0 | $0 |
| 2021 | $6,282 | $648,700 | $0 | $0 |
| 2020 | $6,074 | $627,000 | $467,400 | $159,600 |
| 2019 | $5,969 | $616,133 | $0 | $0 |
| 2018 | $5,865 | $605,267 | $0 | $0 |
| 2017 | $5,761 | $594,400 | $0 | $0 |
| 2016 | -- | $594,400 | $0 | $0 |
| 2015 | $8,849 | $594,400 | $0 | $0 |
| 2014 | $8,849 | $652,100 | $0 | $0 |
Source: Public Records
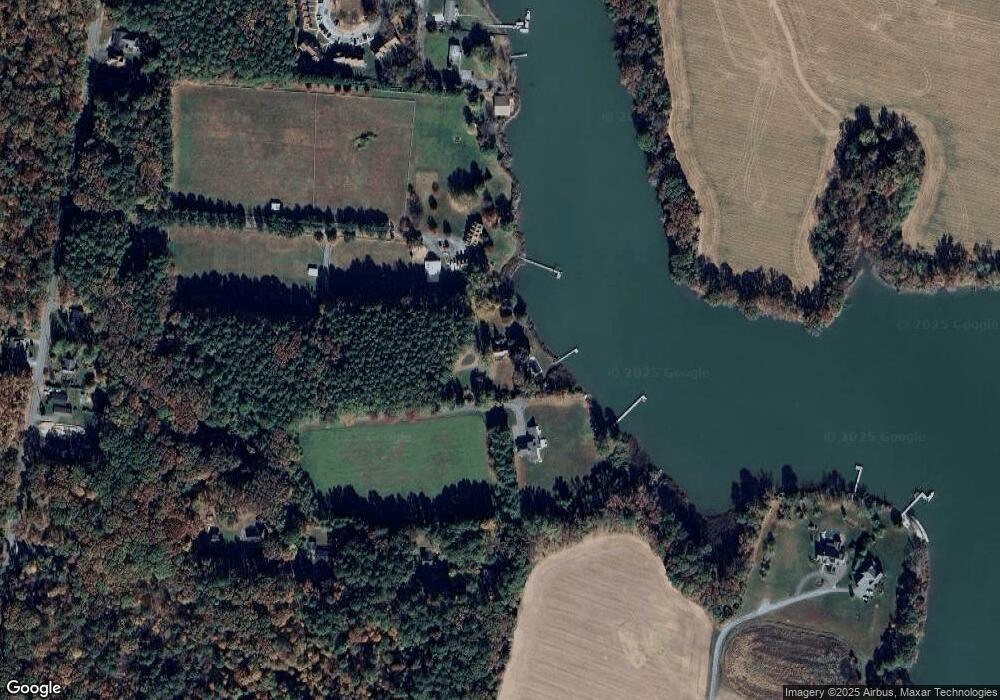
Map
Nearby Homes
- 1221 Cox Neck Rd
- 104 Woods Rd
- Lot 53 Woods Rd
- 123 Bentons Pleasure Rd
- 1405 Little Creek Rd
- 0 Parks Rd
- 0 Bentons Pleasure Rd Unit MDQA2010470
- 0 Newtown Rd
- 635 Dominion Rd
- 162 Kirwans Landing Ln
- 0 Harbor Dr
- 1757 Harbor Dr
- 129 Kirwans Landing Ln
- 2653 Cox Neck Rd
- 315 Cross Creek Ct
- 114 Addison Ct
- 318 Old Point Rd
- 1903 Churchhill Ln
- 600 Old Point Rd
- 7014 Bridgepointe Dr
- 300 Marion Ln
- 143 Edgewood Rd
- 141 Edgewood Rd
- 135 Edgewood Rd
- 131 Edgewood Rd
- 310 Riverside Dr
- 129 Edgewood Rd
- 301 Ganderleigh Farm Ln
- 125 Edgewood Rd
- 123 Edgewood Rd
- 303 Riverside Dr
- 117 Edgewood Rd
- 115 Edgewood Rd
- 113 Edgewood Rd
- 301 Riverside Dr
- 111 Edgewood Rd
- 609 Serenity Ln
- 215 Riverside Dr
- 400 Serenity Ln
- 213 Riverside Dr