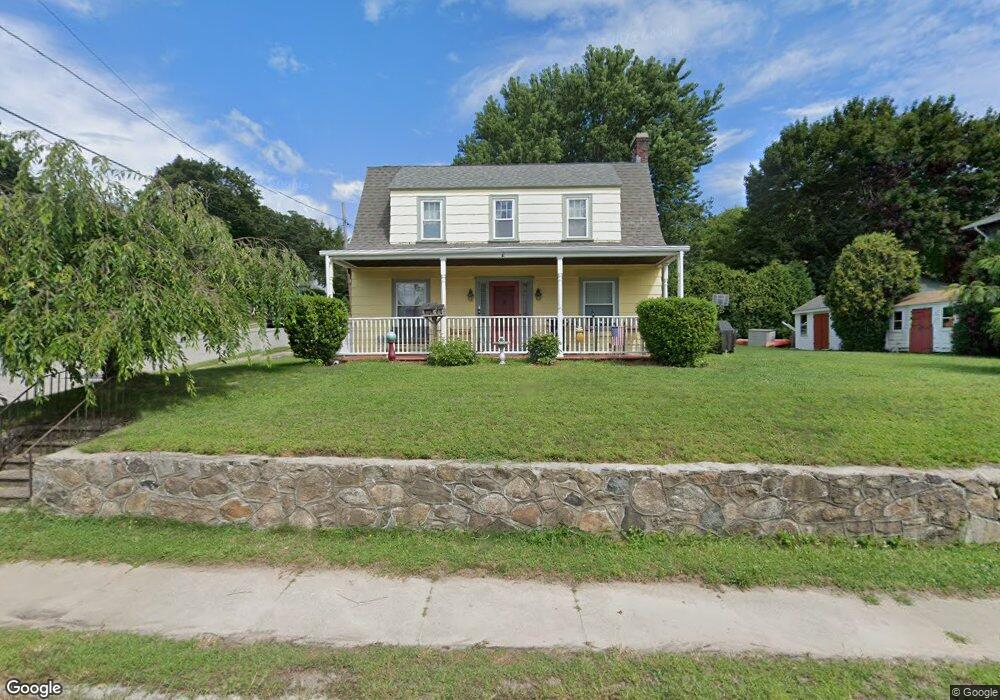
400 Gaskill St Woonsocket, RI 02895
North End NeighborhoodEstimated Value: $384,000 - $452,000
2
Beds
2
Baths
1,920
Sq Ft
$218/Sq Ft
Est. Value
About This Home
This home is located at 400 Gaskill St, Woonsocket, RI 02895 and is currently estimated at $419,306, approximately $218 per square foot. 400 Gaskill St is a home located in Providence County with nearby schools including Woonsocket High School and Mount Saint Charles Academy.
Ownership History
Date
Name
Owned For
Owner Type
Purchase Details
Closed on
Nov 16, 2006
Sold by
Carrier Michelle L
Bought by
Chenot Mark L and Bouchard Linda J
Current Estimated Value
Home Financials for this Owner
Home Financials are based on the most recent Mortgage that was taken out on this home.
Original Mortgage
$200,000
Outstanding Balance
$116,624
Interest Rate
6.33%
Mortgage Type
Purchase Money Mortgage
Estimated Equity
$302,682
Purchase Details
Closed on
May 31, 2001
Sold by
Clancy John G
Bought by
Carrier Michelle L
Purchase Details
Closed on
Sep 25, 1991
Sold by
Baldelli Michelle
Bought by
Clancy John G
Create a Home Valuation Report for This Property
The Home Valuation Report is an in-depth analysis detailing your home's value as well as a comparison with similar homes in the area
Home Values in the Area
Average Home Value in this Area
Purchase History
We collect this data history from publicly available records. To have your information removed, we recommend requesting removal directly through your county’s website.
| Date | Buyer | Sale Price | Title Company |
|---|---|---|---|
| Chenot Mark L | $250,000 | -- | |
| Carrier Michelle L | $158,000 | -- | |
| Chenot Mark L | $250,000 | -- | |
| Carrier Michelle L | $158,000 | -- | |
| Clancy John G | $117,000 | -- |
Source: Public Records
Mortgage History
We collect this data history from publicly available records. To have your information removed, we recommend requesting removal directly through your county’s website.
| Date | Status | Borrower | Loan Amount |
|---|---|---|---|
| Open | Clancy John G | $200,000 | |
| Closed | Clancy John G | $25,000 | |
| Closed | Clancy John G | $200,000 |
Source: Public Records
Tax History
| Year | Tax Paid | Tax Assessment Tax Assessment Total Assessment is a certain percentage of the fair market value that is determined by local assessors to be the total taxable value of land and additions on the property. | Land | Improvement |
|---|---|---|---|---|
| 2025 | $3,945 | $351,300 | $101,700 | $249,600 |
| 2024 | $3,850 | $264,800 | $96,600 | $168,200 |
| 2023 | $3,702 | $264,800 | $96,600 | $168,200 |
| 2022 | $3,702 | $264,800 | $96,600 | $168,200 |
| 2021 | $4,140 | $174,300 | $58,100 | $116,200 |
| 2020 | $4,183 | $174,300 | $58,100 | $116,200 |
| 2018 | $4,197 | $174,300 | $58,100 | $116,200 |
| 2017 | $4,750 | $157,800 | $53,300 | $104,500 |
| 2016 | $5,024 | $157,800 | $53,300 | $104,500 |
| 2015 | $5,772 | $157,800 | $53,300 | $104,500 |
| 2014 | $5,499 | $153,000 | $58,700 | $94,300 |
Source: Public Records
Map
Nearby Homes
- 448 Gaskill St
- 495 Gaskill St
- 447 Winter St
- 469 Winter St
- 571 Winter St
- 36 Fairway Ln Unit 36
- 481 N Main St
- 144 Woodland Rd
- 70 Woodland Rd
- 185 Spring St
- 11 Katherine Rd
- 15 Lewis St
- 159 Earle St
- 246 Harris Ave
- 187 Boyden St
- 283 Privilege St Unit 4
- 0 N Main St Unit 1401765
- 20 Ascension St
- 0 Diamond Hill Rd Unit 1406968
- 708 3rd Ave
Your Personal Tour Guide
Ask me questions while you tour the home.