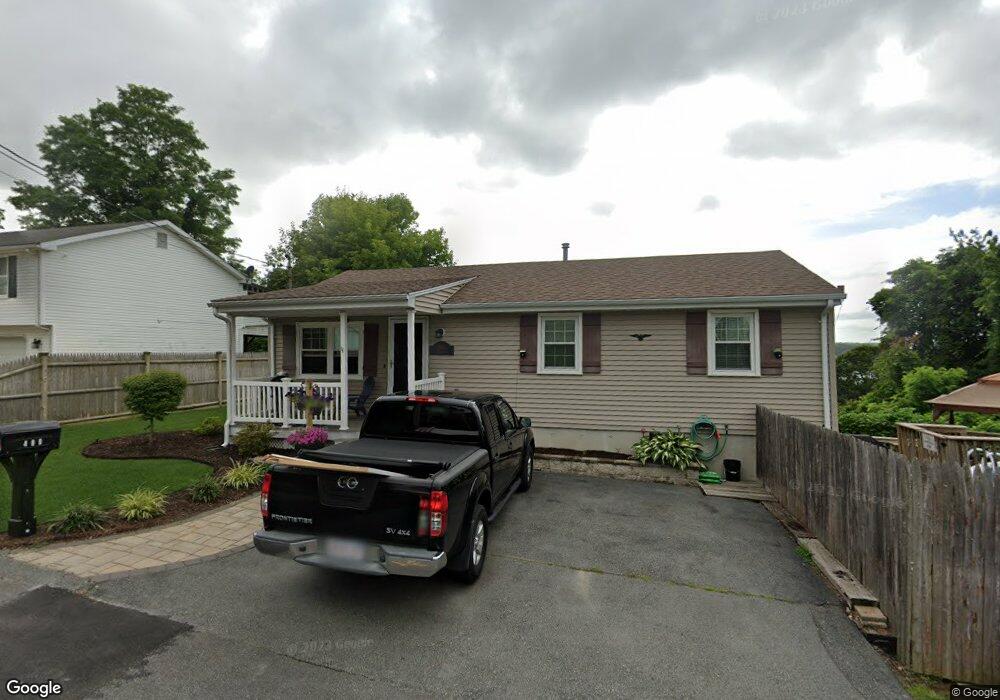
400 Gibbs St Fall River, MA 02720
Western Fall River NeighborhoodEstimated Value: $373,085 - $455,000
3
Beds
1
Bath
960
Sq Ft
$419/Sq Ft
Est. Value
About This Home
This home is located at 400 Gibbs St, Fall River, MA 02720 and is currently estimated at $402,521, approximately $419 per square foot. 400 Gibbs St is a home located in Bristol County with nearby schools including North End Elementary School, Morton Middle School, and B M C Durfee High School.
Ownership History
Date
Name
Owned For
Owner Type
Purchase Details
Closed on
Feb 1, 1994
Sold by
Family Home Constr Co
Bought by
Cordeiro Steven F and Cordeiro Lucia M
Current Estimated Value
Home Financials for this Owner
Home Financials are based on the most recent Mortgage that was taken out on this home.
Original Mortgage
$91,650
Interest Rate
7.11%
Mortgage Type
Purchase Money Mortgage
Create a Home Valuation Report for This Property
The Home Valuation Report is an in-depth analysis detailing your home's value as well as a comparison with similar homes in the area
Home Values in the Area
Average Home Value in this Area
Purchase History
| Date | Buyer | Sale Price | Title Company |
|---|---|---|---|
| Cordeiro Steven F | $96,500 | -- |
Source: Public Records
Mortgage History
| Date | Status | Borrower | Loan Amount |
|---|---|---|---|
| Open | Cordeiro Steven F | $30,000 | |
| Closed | Cordeiro Steven F | $91,650 |
Source: Public Records
Tax History
| Year | Tax Paid | Tax Assessment Tax Assessment Total Assessment is a certain percentage of the fair market value that is determined by local assessors to be the total taxable value of land and additions on the property. | Land | Improvement |
|---|---|---|---|---|
| 2025 | $3,659 | $319,600 | $116,900 | $202,700 |
| 2024 | $3,445 | $299,800 | $114,600 | $185,200 |
| 2023 | $3,454 | $281,500 | $103,200 | $178,300 |
| 2022 | $3,048 | $241,500 | $97,400 | $144,100 |
| 2021 | $2,856 | $206,500 | $93,000 | $113,500 |
| 2020 | $2,750 | $190,300 | $88,800 | $101,500 |
| 2019 | $2,728 | $187,100 | $92,800 | $94,300 |
| 2018 | $2,678 | $183,200 | $93,500 | $89,700 |
| 2017 | $2,542 | $181,600 | $93,500 | $88,100 |
| 2016 | $2,453 | $180,000 | $96,400 | $83,600 |
| 2015 | $2,384 | $182,300 | $96,400 | $85,900 |
| 2014 | $2,293 | $182,300 | $96,400 | $85,900 |
Source: Public Records
Map
Nearby Homes
- 33 Warner St
- 232 Mount Pleasant St
- 257 Calvin St
- 1810 Highland Ave Unit 22
- Parcel 2 Highcrest Rd
- 29 Valentine St
- 318 Crescent St Unit A
- 274 Archer St
- 200 Crescent St
- 247 Albany St
- 333 Langley St
- 230 College Park Rd
- 201 Montgomery Cir
- 1553 Riverside Ave
- 208 Florence St
- 210 Harrison Ave
- 3636 N Main St Unit 5
- 1496 Riverside Ave
- 27 Kane St
- 3682 N Main St Unit 6
Your Personal Tour Guide
Ask me questions while you tour the home.