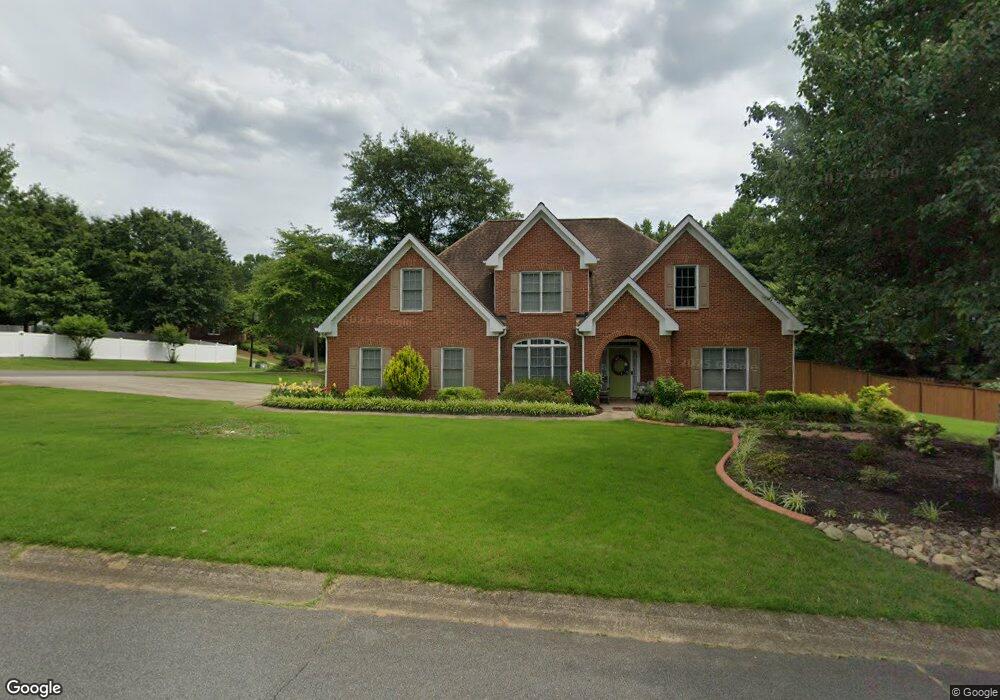
400 Hancock Ct Unit 61 Woodstock, GA 30188
Estimated Value: $477,901 - $483,000
4
Beds
3
Baths
2,306
Sq Ft
$208/Sq Ft
Est. Value
About This Home
This home is located at 400 Hancock Ct Unit 61, Woodstock, GA 30188 and is currently estimated at $480,451, approximately $208 per square foot. 400 Hancock Ct Unit 61 is a home located in Cherokee County with nearby schools including Johnston Elementary School, Mill Creek Middle School, and River Ridge High School.
Ownership History
Date
Name
Owned For
Owner Type
Purchase Details
Closed on
Apr 8, 2014
Sold by
Herrick Thomas J
Bought by
Mitchell Donald and Mitchell Cheryl T
Current Estimated Value
Home Financials for this Owner
Home Financials are based on the most recent Mortgage that was taken out on this home.
Original Mortgage
$176,200
Outstanding Balance
$133,618
Interest Rate
4.43%
Mortgage Type
VA
Estimated Equity
$346,833
Purchase Details
Closed on
May 1, 2001
Sold by
Ranson Otis K
Bought by
Wallace Phillip C and Wallace Amy S
Home Financials for this Owner
Home Financials are based on the most recent Mortgage that was taken out on this home.
Original Mortgage
$166,150
Interest Rate
6.9%
Purchase Details
Closed on
Feb 26, 1997
Sold by
Wind Riverhomes Inc
Bought by
Ranson Otis
Create a Home Valuation Report for This Property
The Home Valuation Report is an in-depth analysis detailing your home's value as well as a comparison with similar homes in the area
Home Values in the Area
Average Home Value in this Area
Purchase History
| Date | Buyer | Sale Price | Title Company |
|---|---|---|---|
| Mitchell Donald | $217,000 | -- | |
| Wallace Phillip C | $174,900 | -- | |
| Ranson Otis | $161,000 | -- |
Source: Public Records
Mortgage History
| Date | Status | Borrower | Loan Amount |
|---|---|---|---|
| Open | Mitchell Donald | $176,200 | |
| Previous Owner | Wallace Phillip C | $166,150 | |
| Closed | Ranson Otis | $0 |
Source: Public Records
Tax History Compared to Growth
Tax History
| Year | Tax Paid | Tax Assessment Tax Assessment Total Assessment is a certain percentage of the fair market value that is determined by local assessors to be the total taxable value of land and additions on the property. | Land | Improvement |
|---|---|---|---|---|
| 2025 | $957 | $176,056 | $40,800 | $135,256 |
| 2024 | $926 | $166,864 | $40,800 | $126,064 |
| 2023 | $797 | $170,352 | $40,800 | $129,552 |
| 2022 | $883 | $140,360 | $32,000 | $108,360 |
| 2021 | $887 | $122,040 | $30,000 | $92,040 |
| 2020 | $846 | $110,080 | $21,200 | $88,880 |
| 2019 | $832 | $106,400 | $20,000 | $86,400 |
| 2018 | $818 | $98,760 | $17,600 | $81,160 |
| 2017 | $819 | $234,700 | $17,600 | $76,280 |
| 2016 | $835 | $228,000 | $17,600 | $73,600 |
| 2015 | $847 | $220,000 | $17,600 | $70,400 |
| 2014 | $781 | $202,200 | $17,600 | $63,280 |
Source: Public Records
Map
Nearby Homes
- 161 Stoney Creek Pkwy
- 614 Springharbor Dr
- 414 New Park Dr
- 160 Highlands Dr
- 505 Lost Creek Dr
- 151 Springwater Trace
- 224 Stone Park Dr
- 707 Evans St
- 2007 Meadows Dr
- 713 Parkside Dr
- 5830 Mill Creek Ln
- 711 Evans St
- 126 Highlands Dr Unit 1
- 306 Serenity Way
- 1095 Ashlin Dr
- 531 Fox Creek Crossing
- 550 Fox Creek Crossing
- 133 Madison Bend
- 400 Hancock Ct
- 112 Copper Ridge Dr Unit 1
- 0 Hancock Ct Unit 7358811
- 0 Hancock Ct Unit 7214345
- 123 Copper Ridge Dr
- 121 Copper Ridge Dr
- 119 Copper Ridge Dr
- 120 Copper Ridge Dr
- 404 Hancock Ct Unit 1
- 403 Hancock Ct Unit 1
- 110 Copper Ridge Dr
- 125 Copper Ridge Dr
- 0 Copper Ridge Dr Unit 7322464
- 0 Copper Ridge Dr Unit 7289655
- 0 Copper Ridge Dr Unit 3166723
- 0 Copper Ridge Dr Unit 7173327
- 0 Copper Ridge Dr
- 117 Copper Ridge Dr
- 127 Copper Ridge Dr Unit 2
- 405 Hancock Ct