400 Hanlon Rd Holliston, MA 01746
Estimated Value: $1,109,000 - $1,278,000
3
Beds
3
Baths
2,320
Sq Ft
$509/Sq Ft
Est. Value
About This Home
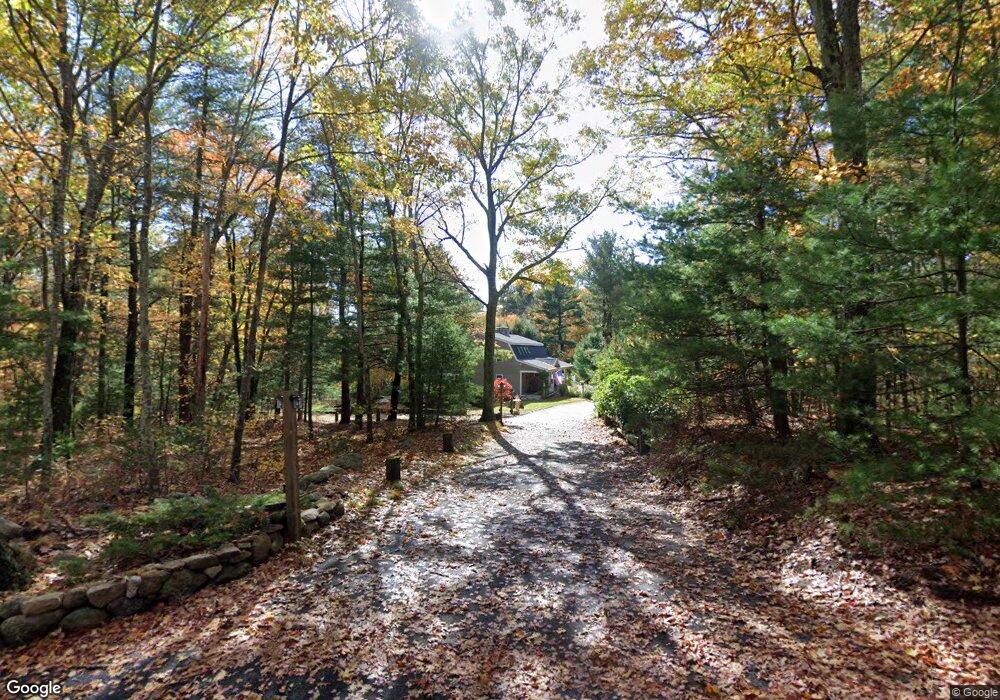
This home is located at 400 Hanlon Rd, Holliston, MA 01746 and is currently estimated at $1,180,299, approximately $508 per square foot. 400 Hanlon Rd is a home located in Middlesex County with nearby schools including Miller Elementary School, Robert H. Adams Middle School, and Holliston High School.
Ownership History
Date
Name
Owned For
Owner Type
Purchase Details
Closed on
May 16, 2023
Sold by
Evans Timothy R
Bought by
Timothy Robert Evans Lt
Current Estimated Value
Purchase Details
Closed on
Jun 21, 2011
Sold by
Evans Timothy R and Martin Murielle
Bought by
Evans Timothy R
Home Financials for this Owner
Home Financials are based on the most recent Mortgage that was taken out on this home.
Original Mortgage
$380,000
Interest Rate
4.58%
Purchase Details
Closed on
Apr 30, 2001
Sold by
Murphy Scott M and Murphy Norma C
Bought by
Evans Timothy R and Martin Murielle
Purchase Details
Closed on
Jan 3, 1997
Sold by
Morvillo Claudio R
Bought by
Murphy Scott M and Murphy Norma C
Purchase Details
Closed on
Nov 14, 1994
Sold by
Morvillo Claudio
Bought by
Armitage James W and Armitage Pamela B
Create a Home Valuation Report for This Property
The Home Valuation Report is an in-depth analysis detailing your home's value as well as a comparison with similar homes in the area
Home Values in the Area
Average Home Value in this Area
Purchase History
| Date | Buyer | Sale Price | Title Company |
|---|---|---|---|
| Timothy Robert Evans Lt | -- | None Available | |
| Evans Timothy R | -- | -- | |
| Evans Timothy R | $442,000 | -- | |
| Murphy Scott M | $373,000 | -- | |
| Armitage James W | $298,000 | -- |
Source: Public Records
Mortgage History
| Date | Status | Borrower | Loan Amount |
|---|---|---|---|
| Previous Owner | Armitage James W | $380,000 | |
| Previous Owner | Armitage James W | $380,000 |
Source: Public Records
Tax History Compared to Growth
Tax History
| Year | Tax Paid | Tax Assessment Tax Assessment Total Assessment is a certain percentage of the fair market value that is determined by local assessors to be the total taxable value of land and additions on the property. | Land | Improvement |
|---|---|---|---|---|
| 2025 | $14,605 | $996,900 | $319,100 | $677,800 |
| 2024 | $14,427 | $958,000 | $319,100 | $638,900 |
| 2023 | $13,370 | $868,200 | $319,100 | $549,100 |
| 2022 | $12,913 | $743,000 | $319,100 | $423,900 |
| 2021 | $11,006 | $616,600 | $259,900 | $356,700 |
| 2020 | $11,934 | $633,100 | $232,700 | $400,400 |
| 2019 | $11,731 | $623,000 | $226,300 | $396,700 |
| 2018 | $11,420 | $611,700 | $226,300 | $385,400 |
| 2017 | $10,673 | $576,300 | $217,500 | $358,800 |
| 2016 | $10,470 | $557,200 | $191,100 | $366,100 |
| 2015 | $10,862 | $560,500 | $165,500 | $395,000 |
Source: Public Records
Map
Nearby Homes
- Lot 2 Hanlon Rd
- 2 Emerald Dr
- 1 Emerald Dr
- 10 Oak St
- 114 Walden Way Unit 114
- 5 Myrtle Ave Unit 2
- 7 Myrtle Ave Unit 3
- 11 Myrtle Ave Unit 5
- 4 Myrtle Ave Unit 20
- 13 Fitch Ave
- 13 Fitch Ave Unit 19
- 16 Fitch Ave Unit 6
- 11 Fitch Ave Unit 18
- 14 Fitch Ave Unit 7
- 12 Fitch Ave Unit 8
- 0 Mcgill Ln
- 165 Lumber St
- 25 Glen Rd
- 10 Fitch Ave Unit 9
- 75 Ridge Rd