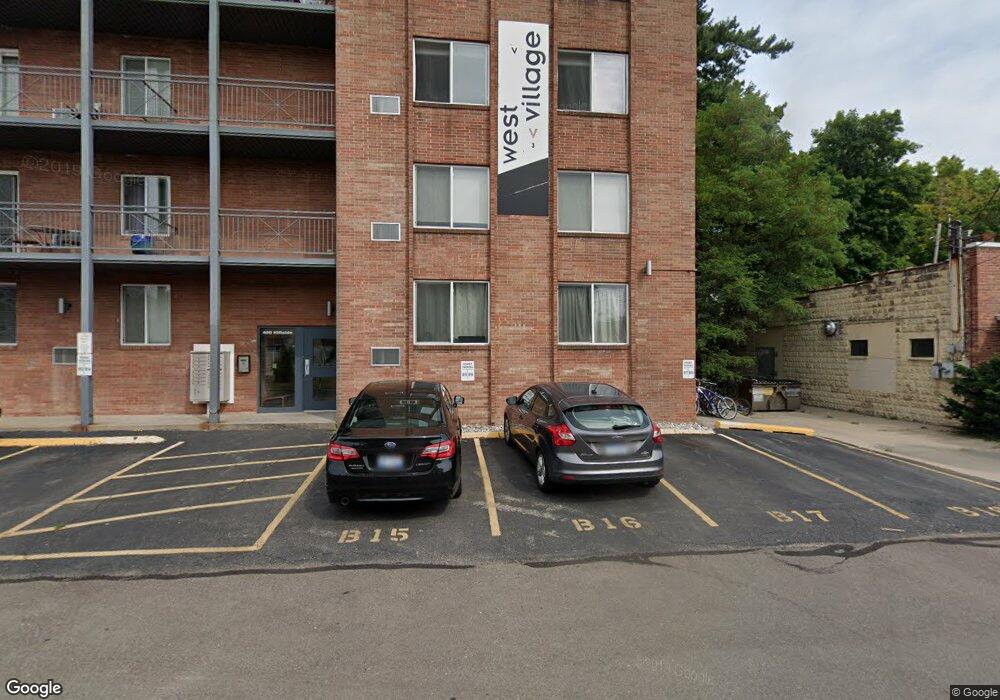
400 Hillside Ct Unit 5 East Lansing, MI 48823
Estimated Value: $114,000 - $163,000
--
Bed
1
Bath
522
Sq Ft
$268/Sq Ft
Est. Value
About This Home
This home is located at 400 Hillside Ct Unit 5, East Lansing, MI 48823 and is currently estimated at $139,661, approximately $267 per square foot. 400 Hillside Ct Unit 5 is a home located in Ingham County with nearby schools including Glencairn School, MacDonald Middle School, and East Lansing High School.
Create a Home Valuation Report for This Property
The Home Valuation Report is an in-depth analysis detailing your home's value as well as a comparison with similar homes in the area
Home Values in the Area
Average Home Value in this Area
Tax History Compared to Growth
Tax History
| Year | Tax Paid | Tax Assessment Tax Assessment Total Assessment is a certain percentage of the fair market value that is determined by local assessors to be the total taxable value of land and additions on the property. | Land | Improvement |
|---|---|---|---|---|
| 2025 | $2,679 | $53,800 | $0 | $53,800 |
| 2024 | $2,514 | $51,300 | $0 | $51,300 |
| 2023 | $2,514 | $54,400 | $0 | $54,400 |
| 2022 | $2,405 | $49,100 | $0 | $49,100 |
| 2021 | $2,355 | $46,200 | $0 | $46,200 |
| 2020 | $2,328 | $45,100 | $0 | $45,100 |
| 2019 | $2,245 | $36,400 | $0 | $36,400 |
| 2018 | $2,390 | $34,800 | $0 | $34,800 |
| 2017 | $2,305 | $33,600 | $0 | $33,600 |
| 2016 | -- | $31,100 | $0 | $31,100 |
| 2015 | -- | $28,900 | $0 | $0 |
| 2014 | -- | $40,000 | $0 | $0 |
Source: Public Records
Map
Nearby Homes
- 351 Oakhill Ave Unit 207
- 620 Ardson Rd
- 815 Westlawn Ave
- 904 Sunset Ln
- 953 Rosewood Ave
- 220 Mac Ave Unit 302
- 922 Michigan Ave
- 350 Kensington Rd
- 353 Division St
- 119 Kensington Rd
- 728 Audubon Rd
- 408 Whitehills Dr
- 696 Beech St
- 338 W Saginaw St Unit 48
- 704 Beech St
- 992 Touraine Ave
- 1207 Chartwell Carriage Way S
- 615 Glenmoor Rd Unit 2A
- 523 Bainbridge Dr Unit 37
- 1412 N Harrison Rd
- 400 Hillside Ct Unit 7
- 400 Hillside Ct Unit 8
- 400 Hillside Ct Unit 107
- 400 Hillside Ct Unit 103
- 400 Hillside Ct Unit 3
- 400 Hillside Ct Unit 100
- 400 Hillside Ct Unit 101
- 400 Hillside Ct Unit 102
- 400 Hillside Ct Unit 104
- 400 Hillside Ct Unit 105
- 400 Hillside Ct Unit 106
- 400 Hillside Ct Unit 4
- 400 Hillside Ct Unit 6&7
- 400 Hillside Ct
- 351 Oakhill Ave Unit 204
- 351 Oakhill Ave Unit 205
- 351 Oakhill Ave Unit 206
- 351 Oakhill Ave Unit 300
- 351 Oakhill Ave Unit 301
- 351 Oakhill Ave Unit 302