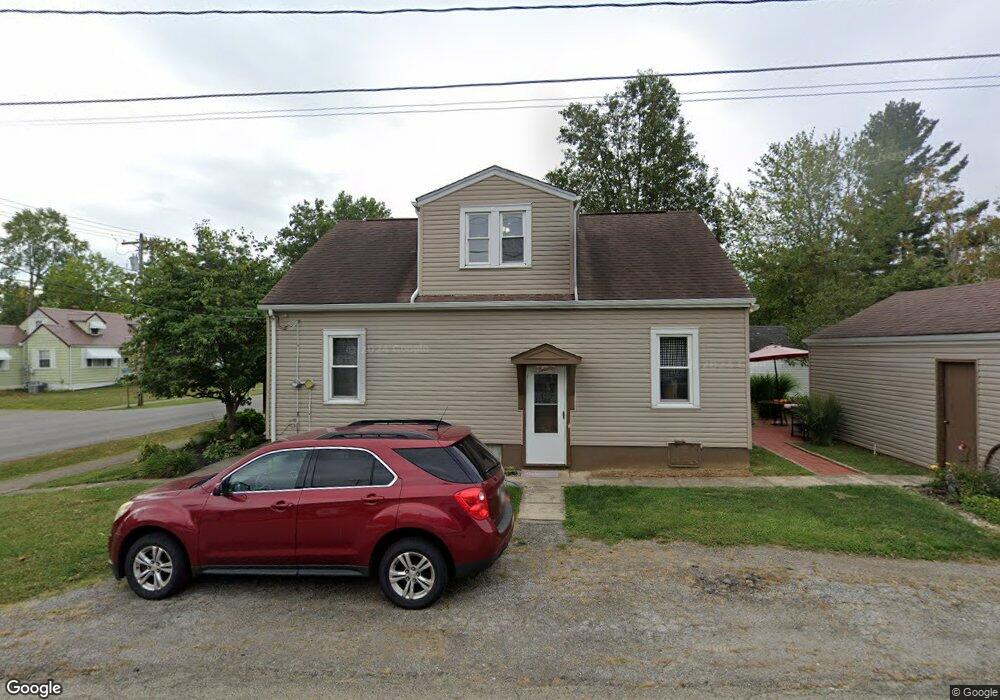
400 Home St Georgetown, OH 45121
Estimated Value: $146,784 - $172,000
2
Beds
1
Bath
1,308
Sq Ft
$123/Sq Ft
Est. Value
About This Home
This home is located at 400 Home St, Georgetown, OH 45121 and is currently estimated at $160,946, approximately $123 per square foot. 400 Home St is a home located in Brown County with nearby schools including Georgetown Elementary School and Georgetown Jr/Sr High School.
Ownership History
Date
Name
Owned For
Owner Type
Purchase Details
Closed on
Apr 19, 1999
Sold by
Poole Nancy S
Bought by
Sowers Michael W
Current Estimated Value
Home Financials for this Owner
Home Financials are based on the most recent Mortgage that was taken out on this home.
Original Mortgage
$60,500
Outstanding Balance
$15,396
Interest Rate
7.1%
Mortgage Type
New Conventional
Estimated Equity
$145,550
Purchase Details
Closed on
Jul 7, 1994
Sold by
Myers John W
Bought by
Poole Nancy S
Home Financials for this Owner
Home Financials are based on the most recent Mortgage that was taken out on this home.
Original Mortgage
$36,800
Interest Rate
8.61%
Mortgage Type
New Conventional
Create a Home Valuation Report for This Property
The Home Valuation Report is an in-depth analysis detailing your home's value as well as a comparison with similar homes in the area
Home Values in the Area
Average Home Value in this Area
Purchase History
| Date | Buyer | Sale Price | Title Company |
|---|---|---|---|
| Sowers Michael W | $58,000 | -- | |
| Poole Nancy S | $46,000 | -- |
Source: Public Records
Mortgage History
| Date | Status | Borrower | Loan Amount |
|---|---|---|---|
| Open | Sowers Michael W | $60,500 | |
| Previous Owner | Poole Nancy S | $36,800 |
Source: Public Records
Tax History Compared to Growth
Tax History
| Year | Tax Paid | Tax Assessment Tax Assessment Total Assessment is a certain percentage of the fair market value that is determined by local assessors to be the total taxable value of land and additions on the property. | Land | Improvement |
|---|---|---|---|---|
| 2024 | $1,225 | $34,590 | $1,480 | $33,110 |
| 2023 | $1,225 | $28,690 | $1,250 | $27,440 |
| 2022 | $1,106 | $28,690 | $1,250 | $27,440 |
| 2021 | $1,096 | $28,690 | $1,250 | $27,440 |
| 2020 | $970 | $23,910 | $1,040 | $22,870 |
| 2019 | $963 | $23,910 | $1,040 | $22,870 |
| 2018 | $956 | $23,910 | $1,040 | $22,870 |
| 2017 | $687 | $20,400 | $1,100 | $19,300 |
| 2016 | $687 | $20,400 | $1,100 | $19,300 |
| 2015 | $722 | $20,400 | $1,100 | $19,300 |
| 2014 | $722 | $20,300 | $1,000 | $19,300 |
| 2013 | $720 | $20,300 | $1,000 | $19,300 |
Source: Public Records
Map
Nearby Homes
- 418 Home St
- 666 E State St
- 505 S Water St
- 104 Elm St
- 708 E State St
- 25 Douglas Ln
- 406 E North St
- 402 S Pleasant St
- 0 Douglas Ln Unit 1641744
- 60 New St
- 306 W 2nd St
- 403 Elmwood Ct
- 401 Elmwood Ct
- 155 Free Soil Rd
- 405 N Main St
- 175 Douglas Cir
- 102 Bill Dee Dr
- 27 Marilyn Dr
- 508 Mount Orab Pike
- 331 Spring Grove Dr