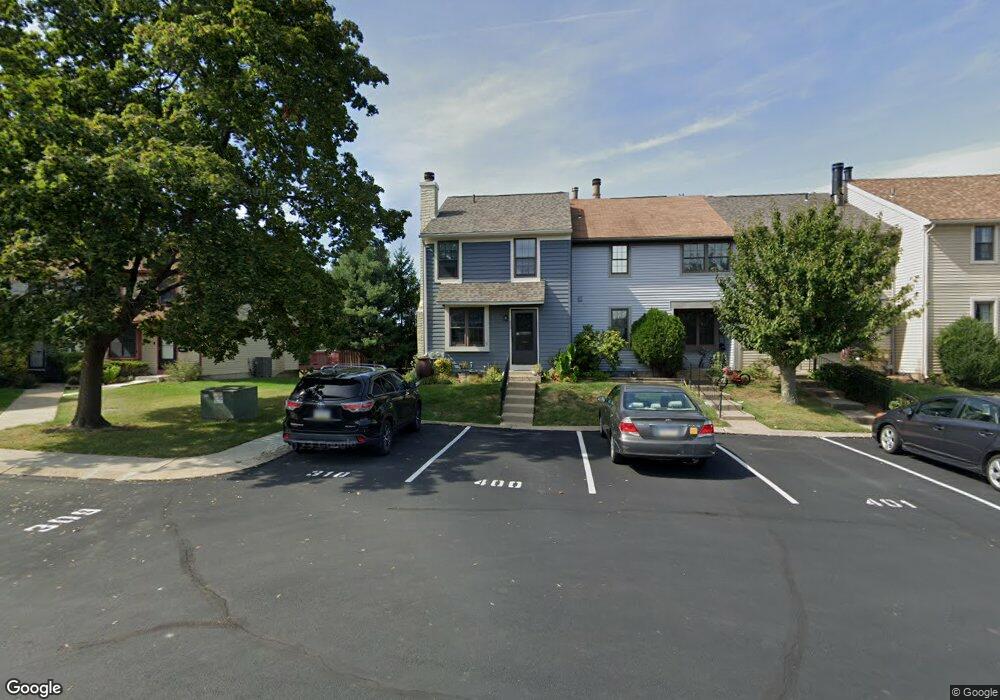
400 Hopkins Ct North Wales, PA 19454
Estimated Value: $281,000 - $290,247
2
Beds
2
Baths
1,080
Sq Ft
$264/Sq Ft
Est. Value
About This Home
This home is located at 400 Hopkins Ct, North Wales, PA 19454 and is currently estimated at $285,562, approximately $264 per square foot. 400 Hopkins Ct is a home located in Montgomery County with nearby schools including Montgomery Elementary School, Pennbrook Middle School, and North Penn Senior High School.
Ownership History
Date
Name
Owned For
Owner Type
Purchase Details
Closed on
Nov 4, 2016
Sold by
Gallagher Jillian A
Bought by
Gallagher Jillian A and Duminiak Robert J
Current Estimated Value
Home Financials for this Owner
Home Financials are based on the most recent Mortgage that was taken out on this home.
Original Mortgage
$140,000
Outstanding Balance
$89,691
Interest Rate
3.42%
Mortgage Type
New Conventional
Estimated Equity
$195,871
Purchase Details
Closed on
Sep 18, 2009
Sold by
Reiley Blair T
Bought by
Gallagher Jillian A
Home Financials for this Owner
Home Financials are based on the most recent Mortgage that was taken out on this home.
Original Mortgage
$155,200
Interest Rate
5.12%
Purchase Details
Closed on
Feb 10, 1999
Sold by
Oconnor Finbarr W
Bought by
Retley Blair T
Create a Home Valuation Report for This Property
The Home Valuation Report is an in-depth analysis detailing your home's value as well as a comparison with similar homes in the area
Home Values in the Area
Average Home Value in this Area
Purchase History
| Date | Buyer | Sale Price | Title Company |
|---|---|---|---|
| Gallagher Jillian A | -- | Attorney | |
| Gallagher Jillian A | $160,000 | None Available | |
| Retley Blair T | $82,000 | -- |
Source: Public Records
Mortgage History
| Date | Status | Borrower | Loan Amount |
|---|---|---|---|
| Open | Gallagher Jillian A | $140,000 | |
| Closed | Gallagher Jillian A | $155,200 |
Source: Public Records
Tax History Compared to Growth
Tax History
| Year | Tax Paid | Tax Assessment Tax Assessment Total Assessment is a certain percentage of the fair market value that is determined by local assessors to be the total taxable value of land and additions on the property. | Land | Improvement |
|---|---|---|---|---|
| 2025 | $3,327 | $89,170 | $19,600 | $69,570 |
| 2024 | $3,327 | $89,170 | $19,600 | $69,570 |
| 2023 | $3,174 | $89,170 | $19,600 | $69,570 |
| 2022 | $3,062 | $89,170 | $19,600 | $69,570 |
| 2021 | $2,879 | $89,170 | $19,600 | $69,570 |
| 2020 | $2,803 | $89,170 | $19,600 | $69,570 |
| 2019 | $2,751 | $89,170 | $19,600 | $69,570 |
| 2018 | $431 | $89,170 | $19,600 | $69,570 |
| 2017 | $2,633 | $89,170 | $19,600 | $69,570 |
| 2016 | $2,598 | $89,170 | $19,600 | $69,570 |
| 2015 | $2,547 | $89,170 | $19,600 | $69,570 |
| 2014 | $2,481 | $89,170 | $19,600 | $69,570 |
Source: Public Records
Map
Nearby Homes
- 307 Livingston Ct
- 302 Hancock Ct
- 1308 Morris Ct
- 101 Pioneer Dr
- 981 Horsham Rd
- 405 Country Club Dr
- 1204 Vilsmeier Rd
- 101 Devon Ct
- 107 David Ln
- 110 Country Club Dr
- 501 Joshua Ct
- 182 Filly Dr
- 219 Pinecrest Ln
- 304 Joshua Ct
- 105 Preston Dr
- 137 Steeplechase Dr
- 106 Jene Ct
- 219 Red Haven Dr
- 200 Anthony Ct
- 228 Red Haven Dr
- 401 Hopkins Ct
- 310 Hopkins Ct
- 403 Hopkins Ct
- 404 Hopkins Ct
- 307 Hopkins Ct
- 309 Hopkins Ct
- 308 Hopkins Ct
- 306 Hopkins Ct
- 405 Hopkins Ct
- 305 Hopkins Ct
- 406 Hopkins Ct
- 304 Hopkins Ct
- 407 Hopkins Ct
- 302 Hopkins Ct
- 408 Hopkins Ct
- 404 Livingston Ct
- 405 Livingston Ct
- 301 Hopkins Ct
- 406 Livingston Ct
- 403 Livingston Ct