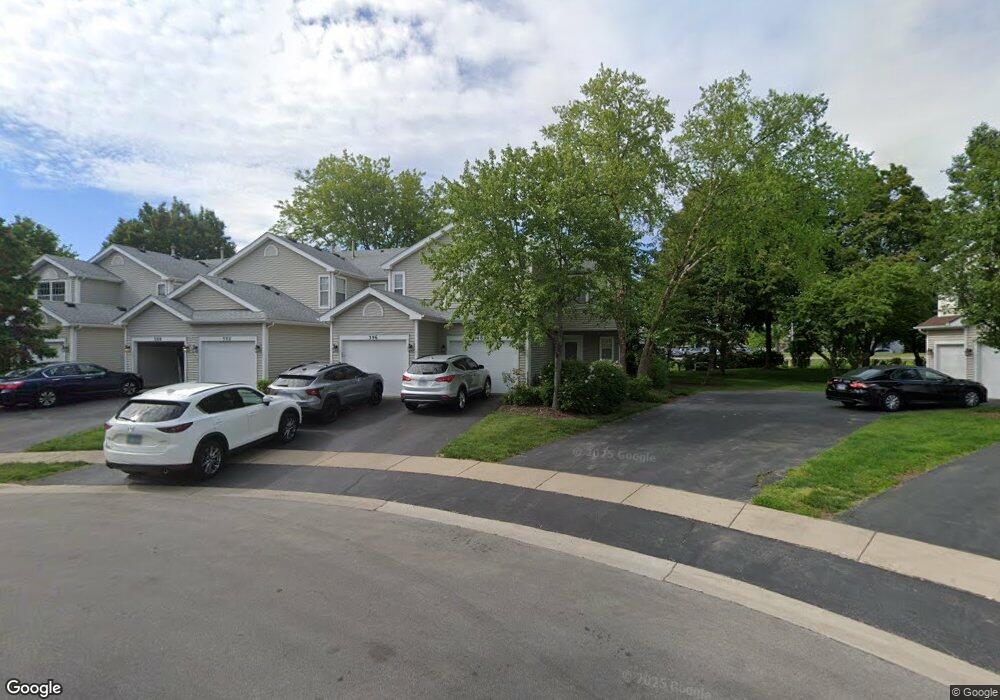
400 Hunterdon Ct Unit 5400B Schaumburg, IL 60194
West Schaumburg NeighborhoodEstimated Value: $304,000 - $330,000
2
Beds
--
Bath
1,200
Sq Ft
$262/Sq Ft
Est. Value
About This Home
This home is located at 400 Hunterdon Ct Unit 5400B, Schaumburg, IL 60194 and is currently estimated at $314,627, approximately $262 per square foot. 400 Hunterdon Ct Unit 5400B is a home located in Cook County with nearby schools including Glenbrook Elementary School, Canton Middle School, and Streamwood High School.
Ownership History
Date
Name
Owned For
Owner Type
Purchase Details
Closed on
May 24, 2001
Sold by
Costantino Erik and Costantino Denise
Bought by
Matel Elzbieta and Matel Jerzy
Current Estimated Value
Home Financials for this Owner
Home Financials are based on the most recent Mortgage that was taken out on this home.
Original Mortgage
$130,400
Outstanding Balance
$49,160
Interest Rate
7.16%
Estimated Equity
$265,467
Purchase Details
Closed on
Dec 15, 1999
Sold by
Costantino Erik
Bought by
Costantino Erik and Costantino Denise
Purchase Details
Closed on
Jun 11, 1996
Sold by
Ideta Jack M
Bought by
Costantino Erik
Home Financials for this Owner
Home Financials are based on the most recent Mortgage that was taken out on this home.
Original Mortgage
$134,640
Interest Rate
8.05%
Mortgage Type
VA
Create a Home Valuation Report for This Property
The Home Valuation Report is an in-depth analysis detailing your home's value as well as a comparison with similar homes in the area
Home Values in the Area
Average Home Value in this Area
Purchase History
| Date | Buyer | Sale Price | Title Company |
|---|---|---|---|
| Matel Elzbieta | $163,000 | -- | |
| Costantino Erik | -- | -- | |
| Costantino Erik | $132,000 | -- |
Source: Public Records
Mortgage History
| Date | Status | Borrower | Loan Amount |
|---|---|---|---|
| Open | Matel Elzbieta | $130,400 | |
| Previous Owner | Costantino Erik | $134,640 |
Source: Public Records
Tax History Compared to Growth
Tax History
| Year | Tax Paid | Tax Assessment Tax Assessment Total Assessment is a certain percentage of the fair market value that is determined by local assessors to be the total taxable value of land and additions on the property. | Land | Improvement |
|---|---|---|---|---|
| 2024 | $5,255 | $21,978 | $2,746 | $19,232 |
| 2023 | $5,107 | $21,978 | $2,746 | $19,232 |
| 2022 | $5,107 | $21,978 | $2,746 | $19,232 |
| 2021 | $4,596 | $17,300 | $3,346 | $13,954 |
| 2020 | $4,615 | $17,300 | $3,346 | $13,954 |
| 2019 | $4,650 | $19,399 | $3,346 | $16,053 |
| 2018 | $3,484 | $14,255 | $2,917 | $11,338 |
| 2017 | $3,475 | $14,255 | $2,917 | $11,338 |
| 2016 | $3,521 | $14,255 | $2,917 | $11,338 |
| 2015 | $3,902 | $14,542 | $706 | $13,836 |
| 2014 | $3,873 | $14,542 | $706 | $13,836 |
| 2013 | $3,741 | $14,542 | $706 | $13,836 |
Source: Public Records
Map
Nearby Homes
- 368 Glen Byrn Ct Unit 11368A
- 2741 Odlum Dr Unit 3
- 2 Oakmont Ct
- 205 Glasgow Ln Unit V1
- 247 Camel Bend Ct Unit 37247
- 239 Camel Bend Ct Unit 36239
- 226 Sierra Pass Dr Unit 62262
- 217 Sierra Pass Dr Unit 28217
- 198 Camden Ct Unit Z2
- 1968 Quaker Hollow Ln Unit 12
- 171 Sierra Pass Dr Unit 261713
- 208 Judy Ln
- 2933 Heatherwood Dr Unit 1915
- 1924 Quaker Hollow Ln Unit 14
- 1916 Quaker Hollow Ln Unit 14
- 8 Warwick Ct
- 133 White Branch Ct S Unit 539
- 62 Beechmont Ct Unit C
- 323 Green Knoll Ln Unit 1818
- 2868 Belle Ln Unit 143B28
- 396 Hunterdon Ct Unit 5396A
- 392 Hunterdon Ct Unit 5392A
- 388 Hunterdon Ct Unit 5388A
- 380 Hunterdon Ct Unit 5380B
- 384 Hunterdon Ct Unit 5384A
- 395 Hunterdon Ct Unit 4395A
- 379 Hunterdon Ct Unit 4379B
- 379 Hunterdon Ct Unit 379B
- 391 Hunterdon Ct Unit 4391A
- 387 Hunterdon Ct Unit 4387A
- 383 Hunterdon Ct Unit 4383A
- 375 Hunterdon Ct Unit 3375B
- 375 Hunterdon Ct Unit 2375B
- 376 Hunterdon Ct Unit 6376B
- 372 Hunterdon Ct Unit 6372A
- 368 Hunterdon Ct Unit 6368A
- 364 Hunterdon Ct Unit 6364A
- 371 Hunterdon Ct Unit 3371A
- 359 Hunterdon Ct Unit 3359A
- 348 Hunterdon Ct Unit 6348B