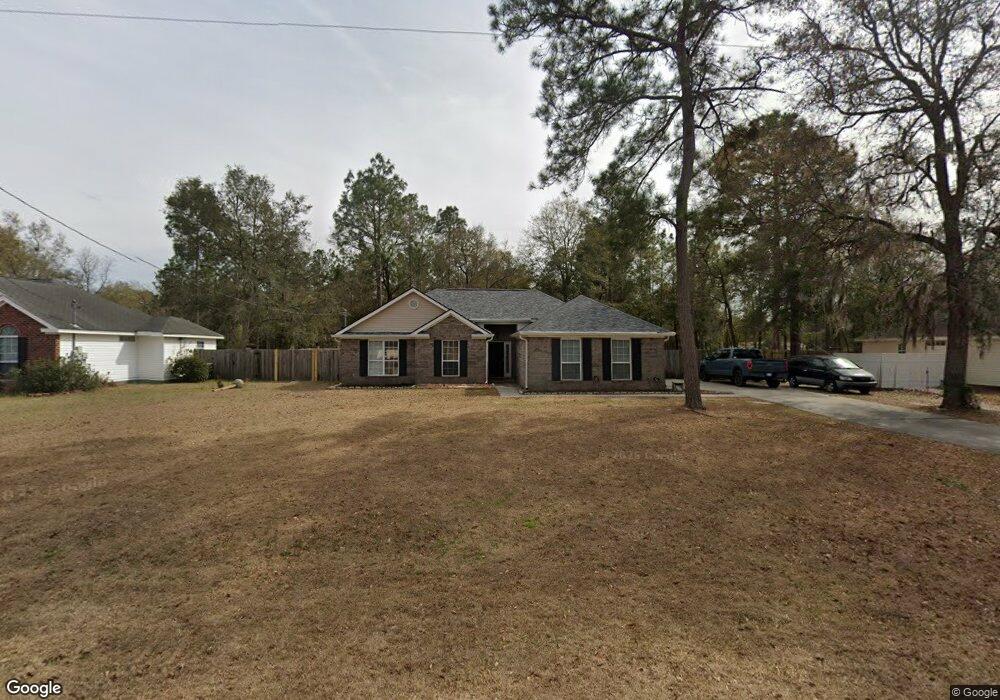
400 Joshua Cir Unit 36 Ellabell, GA 31308
Estimated Value: $273,000 - $295,000
3
Beds
2
Baths
1,309
Sq Ft
$217/Sq Ft
Est. Value
About This Home
This home is located at 400 Joshua Cir Unit 36, Ellabell, GA 31308 and is currently estimated at $283,963, approximately $216 per square foot. 400 Joshua Cir Unit 36 is a home located in Bryan County with nearby schools including Lanier Primary School, Bryan County Elementary School, and Bryan County Middle School.
Ownership History
Date
Name
Owned For
Owner Type
Purchase Details
Closed on
Feb 25, 2008
Sold by
Feider Daniel Lee
Bought by
Feeder Daniel Lee and Feider Eve Elizabeth H
Current Estimated Value
Home Financials for this Owner
Home Financials are based on the most recent Mortgage that was taken out on this home.
Original Mortgage
$136,192
Outstanding Balance
$84,046
Interest Rate
5.65%
Mortgage Type
New Conventional
Estimated Equity
$199,917
Purchase Details
Closed on
Feb 15, 2008
Sold by
Edge Kristopher M
Bought by
Feeder Daniel Lee
Home Financials for this Owner
Home Financials are based on the most recent Mortgage that was taken out on this home.
Original Mortgage
$136,192
Outstanding Balance
$84,046
Interest Rate
5.65%
Mortgage Type
New Conventional
Estimated Equity
$199,917
Purchase Details
Closed on
Feb 28, 2005
Sold by
Beacon Builders Inc
Bought by
Edge Kristopher M
Home Financials for this Owner
Home Financials are based on the most recent Mortgage that was taken out on this home.
Original Mortgage
$120,134
Interest Rate
5.6%
Mortgage Type
New Conventional
Purchase Details
Closed on
May 7, 2004
Bought by
Beacon Builders Inc
Create a Home Valuation Report for This Property
The Home Valuation Report is an in-depth analysis detailing your home's value as well as a comparison with similar homes in the area
Home Values in the Area
Average Home Value in this Area
Purchase History
| Date | Buyer | Sale Price | Title Company |
|---|---|---|---|
| Feeder Daniel Lee | -- | -- | |
| Feeder Daniel Lee | $133,000 | -- | |
| Edge Kristopher M | $123,850 | -- | |
| Beacon Builders Inc | $210,000 | -- |
Source: Public Records
Mortgage History
| Date | Status | Borrower | Loan Amount |
|---|---|---|---|
| Open | Feeder Daniel Lee | $136,192 | |
| Previous Owner | Edge Kristopher M | $120,134 |
Source: Public Records
Tax History Compared to Growth
Tax History
| Year | Tax Paid | Tax Assessment Tax Assessment Total Assessment is a certain percentage of the fair market value that is determined by local assessors to be the total taxable value of land and additions on the property. | Land | Improvement |
|---|---|---|---|---|
| 2024 | $2,277 | $88,280 | $12,400 | $75,880 |
| 2023 | $2,219 | $77,520 | $12,400 | $65,120 |
| 2022 | $1,852 | $71,120 | $12,400 | $58,720 |
| 2021 | $1,642 | $61,520 | $12,400 | $49,120 |
| 2020 | $1,531 | $61,520 | $12,400 | $49,120 |
| 2019 | $1,423 | $52,120 | $8,000 | $44,120 |
| 2018 | $1,360 | $52,120 | $8,000 | $44,120 |
| 2017 | $1,221 | $50,160 | $7,200 | $42,960 |
| 2016 | $1,133 | $46,200 | $7,200 | $39,000 |
| 2015 | $1,148 | $46,640 | $8,000 | $38,640 |
| 2014 | $1,161 | $47,080 | $8,000 | $39,080 |
Source: Public Records
Map
Nearby Homes
- 410 Joshua Cir
- 205 Polk Rd
- 335 Joshua Cir
- 0 MacK English Rd Unit SA345131
- 479 Mannie English Rd
- 120 Bonnie Cir
- 89 Wade Carter Rd
- 725 Blue Gill Rd
- 285 Creekside Cir
- 397 Pine Ridge Dr
- 105 Creekside Cir
- 540 Pine Ridge Dr
- 0 Ga 204 Hwy Unit 328802
- 8 Palmetto Dr
- 215 Orchard Rd
- 65 Stubbs Ln
- 316 Hatcher Run
- 100 Hallelujah Trail
- 50 & 100 Hallelujah Trail
- Lot 6 Charles Shuman Rd