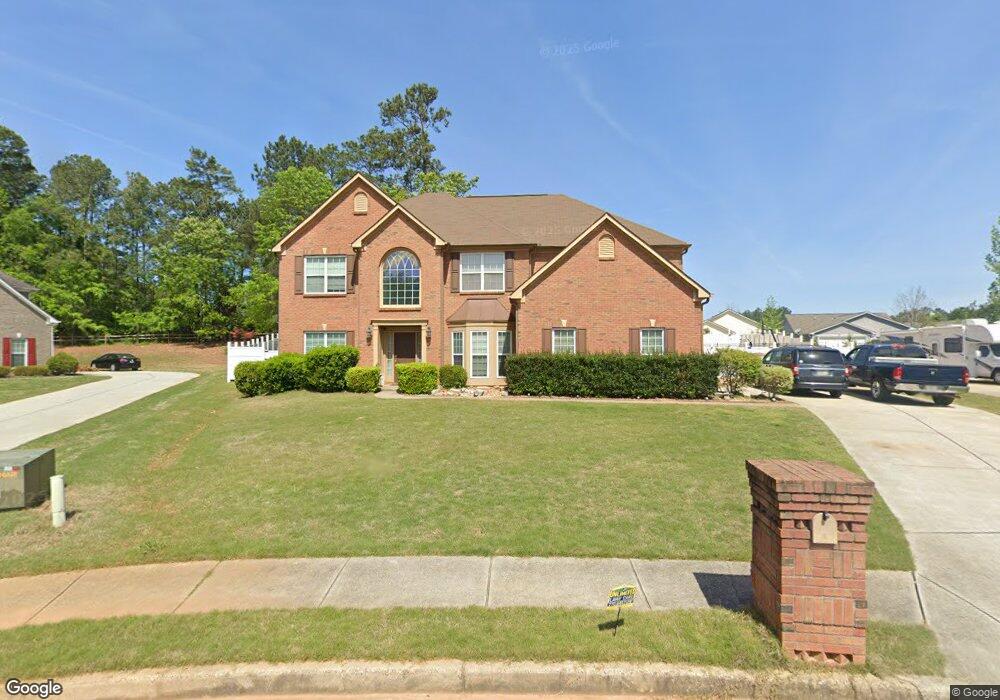
400 Linkmere Ln Covington, GA 30014
Estimated Value: $400,000 - $469,000
5
Beds
4
Baths
3,057
Sq Ft
$140/Sq Ft
Est. Value
About This Home
This home is located at 400 Linkmere Ln, Covington, GA 30014 and is currently estimated at $429,071, approximately $140 per square foot. 400 Linkmere Ln is a home located in Newton County with nearby schools including East Newton Elementary School, Cousins Middle School, and Eastside High School.
Ownership History
Date
Name
Owned For
Owner Type
Purchase Details
Closed on
Dec 28, 2011
Sold by
Federal National Mortgage Association
Bought by
Penn Tracey Renee
Current Estimated Value
Home Financials for this Owner
Home Financials are based on the most recent Mortgage that was taken out on this home.
Original Mortgage
$123,920
Outstanding Balance
$84,045
Interest Rate
4.06%
Mortgage Type
New Conventional
Estimated Equity
$345,026
Purchase Details
Closed on
May 3, 2011
Sold by
Bac Home Loans Servicing Lp
Bought by
Federal Natl Mtg Assn Fnma
Purchase Details
Closed on
Mar 17, 2010
Sold by
Lindo Howien
Bought by
Latouche Evita
Purchase Details
Closed on
Nov 28, 2005
Sold by
The Ryland Grp Inc
Bought by
Lindo Howien and Latouche Evita
Home Financials for this Owner
Home Financials are based on the most recent Mortgage that was taken out on this home.
Original Mortgage
$264,050
Interest Rate
6.28%
Mortgage Type
New Conventional
Create a Home Valuation Report for This Property
The Home Valuation Report is an in-depth analysis detailing your home's value as well as a comparison with similar homes in the area
Home Values in the Area
Average Home Value in this Area
Purchase History
| Date | Buyer | Sale Price | Title Company |
|---|---|---|---|
| Penn Tracey Renee | $154,900 | -- | |
| Federal Natl Mtg Assn Fnma | -- | -- | |
| Bac Home Loans Servicing Lp | $271,618 | -- | |
| Latouche Evita | -- | -- | |
| Lindo Howien | $278,100 | -- |
Source: Public Records
Mortgage History
| Date | Status | Borrower | Loan Amount |
|---|---|---|---|
| Open | Penn Tracey Renee | $123,920 | |
| Previous Owner | Lindo Howien | $264,050 |
Source: Public Records
Tax History
| Year | Tax Paid | Tax Assessment Tax Assessment Total Assessment is a certain percentage of the fair market value that is determined by local assessors to be the total taxable value of land and additions on the property. | Land | Improvement |
|---|---|---|---|---|
| 2025 | $3,787 | $158,280 | $22,400 | $135,880 |
| 2024 | $3,553 | $141,560 | $22,400 | $119,160 |
| 2023 | $3,869 | $144,040 | $13,200 | $130,840 |
| 2022 | $3,286 | $122,560 | $13,200 | $109,360 |
| 2021 | $3,534 | $118,280 | $13,200 | $105,080 |
| 2020 | $3,507 | $107,240 | $13,200 | $94,040 |
| 2019 | $3,666 | $106,440 | $13,200 | $93,240 |
| 2018 | $3,516 | $101,400 | $13,200 | $88,200 |
| 2017 | $2,886 | $83,040 | $13,200 | $69,840 |
| 2016 | $2,454 | $70,440 | $10,000 | $60,440 |
| 2015 | $2,558 | $72,680 | $10,000 | $62,680 |
| 2014 | $2,335 | $66,400 | $0 | $0 |
Source: Public Records
Map
Nearby Homes
- 7703 Fawn Cir
- 85 Bellerive Ln SE
- 7713 Fawn Cir
- 7713 Fawn Cir Unit 51
- 10110 Malcolm Ct
- 10184 Malcolm Dr
- 8193 Monticello St
- 370 Granary Walk
- 9187 Plantation Cir
- 13268 Tolstoy Ln
- 8239 High Lake Terrace SE
- 399 River Walk Farm Unit LOT 12
- 399 River Walk Farm
- 415 River Walk Farm Unit LOT 14
- 20 Kestrel Cir
- 391 River Walk Farm Pkwy #11
- 323 River Walk Farm
- 359 River Walk Farm Pwy #4
- 398 River Walk Farm Pkwy Unit LOT 46
- 428 River Walk Farm
- 390 Linkmere Ln Unit 33
- 390 Linkmere Ln
- 30 Winged Foot Way
- 20 Winged Foot Way
- 40 Winged Foot Way
- 40 Winged Foot Way SE
- 10 Winged Foot Way
- 380 Linkmere Ln
- 50 Winged Foot Way
- 150 Bellerive Ln
- 150 Bellerive Ln Unit 15
- 370 Linkmere Ln
- 395 Linkmere Ln
- 140 Bellerive Ln Unit 14
- 85 Brookline Pkwy
- 10 Baltusrol Way Unit 21
- 10 Baltusrol Way
- 35 Baltusrol Way Unit 58
- 35 Baltusrol Way
- 385 Linkmere Ln
Your Personal Tour Guide
Ask me questions while you tour the home.