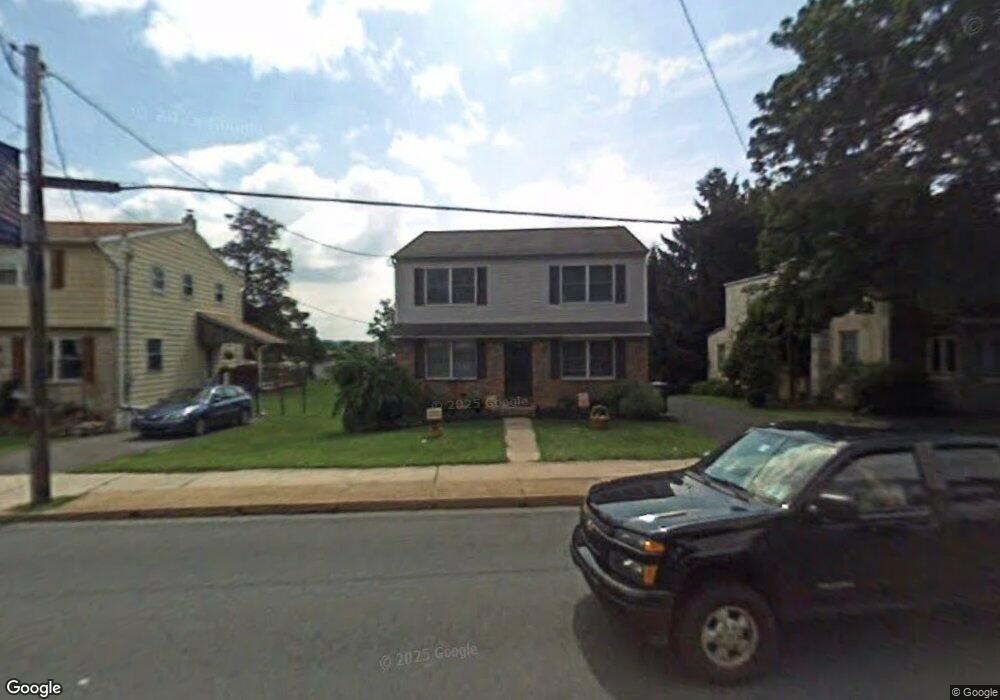
400 Main St Bally, PA 19503
Washington Township Berks NeighborhoodEstimated Value: $340,000 - $391,000
6
Beds
4
Baths
1,920
Sq Ft
$187/Sq Ft
Est. Value
About This Home
This home is located at 400 Main St, Bally, PA 19503 and is currently estimated at $359,504, approximately $187 per square foot. 400 Main St is a home located in Berks County with nearby schools including Boyertown Area Senior High School, Saint Francis Classical Catholic Academy, and St. Francis Academy.
Ownership History
Date
Name
Owned For
Owner Type
Purchase Details
Closed on
Oct 10, 2019
Sold by
Moses Randy A and Moses Marilyn
Bought by
Furches Christopher R
Current Estimated Value
Home Financials for this Owner
Home Financials are based on the most recent Mortgage that was taken out on this home.
Original Mortgage
$191,468
Outstanding Balance
$167,701
Interest Rate
3.49%
Mortgage Type
FHA
Estimated Equity
$191,803
Purchase Details
Closed on
Jul 31, 2006
Sold by
Mcafee Bradley
Bought by
Moses Randy A and Moses Marilyn
Home Financials for this Owner
Home Financials are based on the most recent Mortgage that was taken out on this home.
Original Mortgage
$124,000
Interest Rate
6.7%
Mortgage Type
New Conventional
Purchase Details
Closed on
Apr 15, 2002
Sold by
Panaccion Theodore and Panaccion Anita
Bought by
Mcafee Bradley
Create a Home Valuation Report for This Property
The Home Valuation Report is an in-depth analysis detailing your home's value as well as a comparison with similar homes in the area
Home Values in the Area
Average Home Value in this Area
Purchase History
| Date | Buyer | Sale Price | Title Company |
|---|---|---|---|
| Furches Christopher R | $195,000 | Edge Abstract | |
| Moses Randy A | $155,000 | First American Title Ins Co | |
| Mcafee Bradley | $135,000 | -- |
Source: Public Records
Mortgage History
| Date | Status | Borrower | Loan Amount |
|---|---|---|---|
| Open | Furches Christopher R | $191,468 | |
| Previous Owner | Moses Randy A | $124,000 |
Source: Public Records
Tax History
| Year | Tax Paid | Tax Assessment Tax Assessment Total Assessment is a certain percentage of the fair market value that is determined by local assessors to be the total taxable value of land and additions on the property. | Land | Improvement |
|---|---|---|---|---|
| 2025 | $1,955 | $127,700 | $46,600 | $81,100 |
| 2024 | $5,677 | $127,700 | $46,600 | $81,100 |
| 2023 | $5,475 | $127,700 | $46,600 | $81,100 |
| 2022 | $5,325 | $127,700 | $46,600 | $81,100 |
| 2021 | $5,217 | $127,700 | $46,600 | $81,100 |
| 2020 | $5,106 | $127,700 | $46,600 | $81,100 |
| 2019 | $4,984 | $127,700 | $46,600 | $81,100 |
| 2018 | $4,811 | $127,700 | $46,600 | $81,100 |
| 2017 | $4,679 | $127,700 | $46,600 | $81,100 |
| 2016 | $1,548 | $127,700 | $46,600 | $81,100 |
| 2015 | $1,548 | $127,700 | $46,600 | $81,100 |
| 2014 | $1,548 | $127,700 | $46,600 | $81,100 |
Source: Public Records
Map
Nearby Homes
- 731 Cherry St
- 14 Avalon Cir
- 25 Berks Mont Ln
- 48 Christi Dr
- 70 Sugar Maple Rd
- 5 Sandpiper Dr
- 1 Sandpiper Dr
- 115 Eagles Watch Dr S
- 154 Niantic Rd
- 17 Wilt Rd
- 170 Passmore Rd
- 115 Limekiln Rd
- 233 Congo Niantic Rd
- 1962 Tollgate Rd
- 2131 Weisstown Rd
- 169 Dale Rd
- 2100 Fox Hollow Ln
- 1548 County Line Rd
- 172 Stone Rd
- 22 Apache Run
- 440 Main St
- 436 Main St
- 448 Main St
- 450 Main St
- 428 Main St
- 30 S 5th St
- 424 Main St
- 504 Main St
- 437 Main St
- 418 Main St
- 447 Main St
- 510 Main St
- 427 Main St
- 105 Dogwood St
- 107 Dogwood St
- 107 Dogwood St Unit D-2
- 107 Dogwood St Unit D-1
- 105 Dogwood St Unit C-2
- 105 Dogwood St Unit C-1
- 103 Dogwood St Unit B-2
Your Personal Tour Guide
Ask me questions while you tour the home.