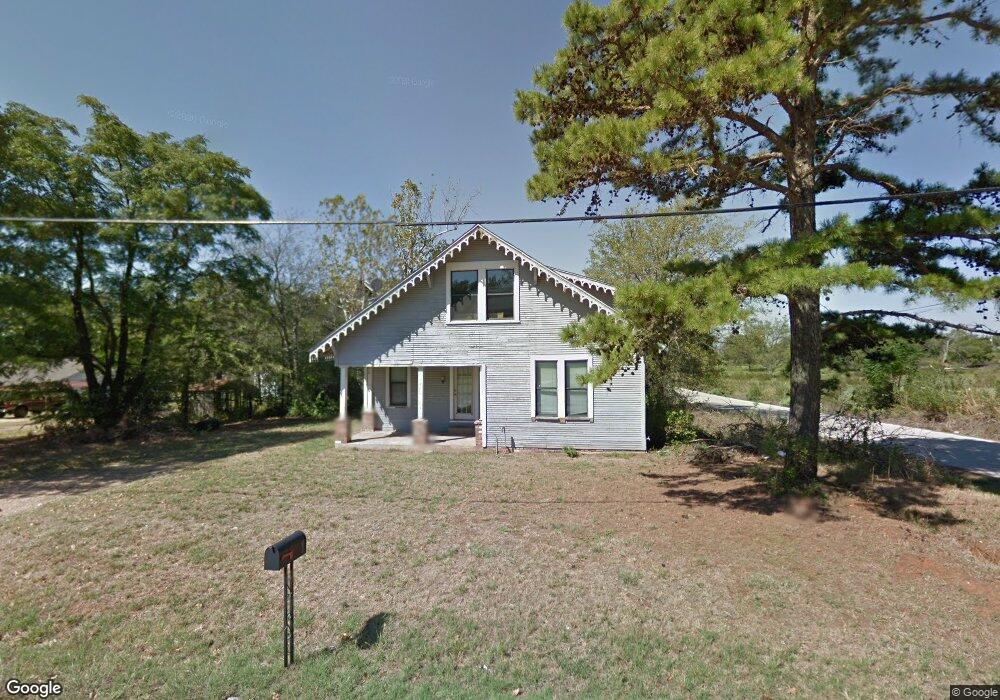
400 Maple St Aubrey, TX 76227
Estimated Value: $286,022 - $421,000
5
Beds
2
Baths
1,984
Sq Ft
$179/Sq Ft
Est. Value
About This Home
This home is located at 400 Maple St, Aubrey, TX 76227 and is currently estimated at $355,756, approximately $179 per square foot. 400 Maple St is a home located in Denton County with nearby schools including HL Brockett Elementary School, Aubrey Middle School, and Aubrey High School.
Ownership History
Date
Name
Owned For
Owner Type
Purchase Details
Closed on
Mar 8, 2014
Sold by
Sadeghian Khosrow
Bought by
Kamy Real Property Trust
Current Estimated Value
Purchase Details
Closed on
Nov 3, 2009
Sold by
Yeager Cory and Yeager Dee
Bought by
Sadeghian Khosrow
Purchase Details
Closed on
Feb 18, 2006
Sold by
Sadeghian Khosrow
Bought by
Yeager Dee and Yeager Cory
Home Financials for this Owner
Home Financials are based on the most recent Mortgage that was taken out on this home.
Original Mortgage
$91,900
Interest Rate
6.05%
Mortgage Type
Seller Take Back
Purchase Details
Closed on
Feb 14, 1995
Sold by
Folse Michael G and Folse Jo Ann
Bought by
Johnson Imogene
Home Financials for this Owner
Home Financials are based on the most recent Mortgage that was taken out on this home.
Original Mortgage
$42,050
Interest Rate
9.14%
Create a Home Valuation Report for This Property
The Home Valuation Report is an in-depth analysis detailing your home's value as well as a comparison with similar homes in the area
Home Values in the Area
Average Home Value in this Area
Purchase History
| Date | Buyer | Sale Price | Title Company |
|---|---|---|---|
| Kamy Real Property Trust | -- | None Available | |
| Sadeghian Amy | -- | None Available | |
| Sadeghian Khosrow | $79,900 | None Available | |
| Yeager Dee | -- | None Available | |
| Johnson Imogene | -- | -- | |
| Johnson Imogene | -- | -- |
Source: Public Records
Mortgage History
| Date | Status | Borrower | Loan Amount |
|---|---|---|---|
| Previous Owner | Yeager Dee | $91,900 | |
| Previous Owner | Johnson Imogene | $42,050 |
Source: Public Records
Tax History Compared to Growth
Tax History
| Year | Tax Paid | Tax Assessment Tax Assessment Total Assessment is a certain percentage of the fair market value that is determined by local assessors to be the total taxable value of land and additions on the property. | Land | Improvement |
|---|---|---|---|---|
| 2025 | $1,335 | $217,000 | $117,128 | $99,872 |
| 2024 | $2,798 | $146,736 | $83,663 | $63,073 |
| 2023 | $2,889 | $151,176 | $83,663 | $67,513 |
| 2022 | $3,098 | $145,746 | $83,663 | $62,083 |
| 2021 | $1,365 | $60,000 | $60,000 | $0 |
| 2020 | $1,868 | $80,000 | $54,381 | $25,619 |
| 2019 | $2,777 | $117,800 | $54,381 | $63,419 |
| 2018 | $2,633 | $115,000 | $54,381 | $60,619 |
| 2016 | $1,901 | $81,913 | $39,321 | $42,592 |
| 2015 | $1,185 | $9,866 | $3,932 | $5,934 |
Source: Public Records
Map
Nearby Homes
- 3529 Maple St
- 506 Caddell St
- 732 Dressage Ln
- 728 Dressage Ln
- 712 Dressage Ln
- 7521 Bird Cherry Ln
- 7313 Bird Cherry Ln
- TBD Rock Hill Rd
- 509 Amy jo Cir
- TBD Farm To Market Road 428
- 3616 Barrel Ln
- 3612 Barrel Ln
- 3617 Barrel Ln
- 313 Countryside Dr
- 309 W Sherman Dr
- TBD De Moye Ln
- 105 E North St
- 506 N Main St
- 613 Countryside
- 604 N Cherry St