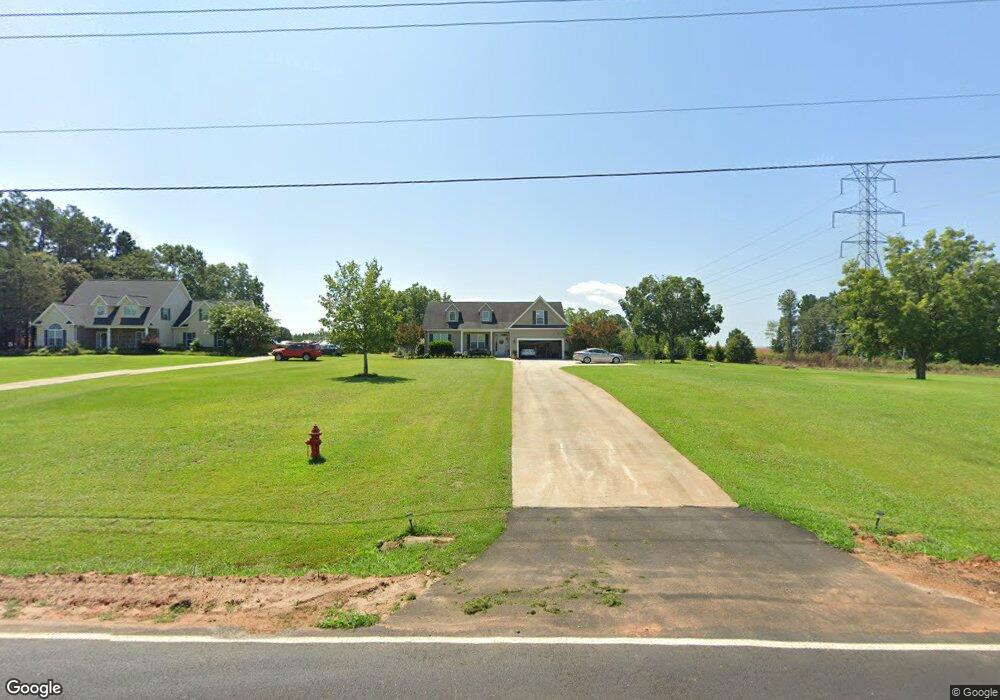
400 Millwee Creek Rd Pendleton, SC 29670
Estimated Value: $411,000 - $458,000
4
Beds
2
Baths
2,436
Sq Ft
$181/Sq Ft
Est. Value
About This Home
This home is located at 400 Millwee Creek Rd, Pendleton, SC 29670 and is currently estimated at $439,885, approximately $180 per square foot. 400 Millwee Creek Rd is a home located in Anderson County with nearby schools including Pendleton High School.
Ownership History
Date
Name
Owned For
Owner Type
Purchase Details
Closed on
Jul 7, 2011
Sold by
Hudson W Royden and Hudson Patricia B
Bought by
Corley Christopher James and Corley Mary Lane
Current Estimated Value
Home Financials for this Owner
Home Financials are based on the most recent Mortgage that was taken out on this home.
Original Mortgage
$199,500
Outstanding Balance
$137,961
Interest Rate
4.62%
Mortgage Type
New Conventional
Estimated Equity
$301,924
Purchase Details
Closed on
Apr 27, 2010
Sold by
Hudson William R and Hudson Patricia B
Bought by
Hudson W Royden and Hudson Patricia B
Purchase Details
Closed on
Aug 13, 2007
Sold by
Vision Homes Inc
Bought by
Hudson William R and Hudson Patricia B
Home Financials for this Owner
Home Financials are based on the most recent Mortgage that was taken out on this home.
Original Mortgage
$200,800
Interest Rate
6.63%
Mortgage Type
Purchase Money Mortgage
Create a Home Valuation Report for This Property
The Home Valuation Report is an in-depth analysis detailing your home's value as well as a comparison with similar homes in the area
Home Values in the Area
Average Home Value in this Area
Purchase History
| Date | Buyer | Sale Price | Title Company |
|---|---|---|---|
| Corley Christopher James | $210,000 | -- | |
| Hudson W Royden | -- | -- | |
| Hudson William R | $251,000 | Attorney |
Source: Public Records
Mortgage History
| Date | Status | Borrower | Loan Amount |
|---|---|---|---|
| Open | Corley Christopher James | $199,500 | |
| Previous Owner | Hudson William R | $200,800 |
Source: Public Records
Tax History
| Year | Tax Paid | Tax Assessment Tax Assessment Total Assessment is a certain percentage of the fair market value that is determined by local assessors to be the total taxable value of land and additions on the property. | Land | Improvement |
|---|---|---|---|---|
| 2024 | $1,782 | $12,300 | $2,360 | $9,940 |
| 2023 | $1,770 | $12,300 | $2,360 | $9,940 |
| 2022 | $1,369 | $10,880 | $2,360 | $8,520 |
| 2021 | $1,193 | $8,430 | $1,420 | $7,010 |
| 2020 | $1,174 | $8,430 | $1,420 | $7,010 |
| 2019 | $1,174 | $8,430 | $1,420 | $7,010 |
| 2018 | $1,184 | $8,430 | $1,420 | $7,010 |
| 2017 | -- | $8,430 | $1,420 | $7,010 |
| 2016 | $1,176 | $8,360 | $1,420 | $6,940 |
| 2015 | $1,183 | $8,360 | $1,420 | $6,940 |
| 2014 | $1,220 | $8,360 | $1,420 | $6,940 |
Source: Public Records
Map
Nearby Homes
- 126 Mays St
- 116 Veranda Cir
- 102 Misty Oaks Ln
- 104 Topeka Ln
- 133 Hurst Ave
- 1409 Autun Rd
- Lot 3 Hwy 76 Hwy
- 814 Conifer Ct
- 810 Conifer Ct
- 115 Creekwalk Dr
- 102 Longleaf Ln
- 406 Shortleaf Ln
- 2407 Watkins Road Extension
- 00 La France Rd
- 2409 Watkins Road Extension
- 00 Jolly Wingo Rd
- 1305 Summers Dr
- 110 Wyndham Dr
- 2014 Pompano Dr
- 2021 Pompano Dr Unit Lot 57
- 400 Milwee Creek Rd
- 402 Millwee Creek Rd
- 860 Blackman Rd
- 337 Millwee Creek Rd
- 858 Blackman Rd
- 409 Millwee Creek Rd
- 410 Millwee Creek Rd
- 856 Blackman Rd
- 854 Blackman Rd Unit 854 Blackman Road
- 854 Blackman Rd
- 852 Blackman Rd
- 506 Millwee Creek Rd
- 506 Millwee Creek Rd
- 850 Blackman Rd
- 848 Blackman Rd
- 229 Millwee Creek Rd
- 846 Blackman Rd
- 105 Moorehead Dr
- 1001 Moorehead Place
- 1009 Moorehead Place
Your Personal Tour Guide
Ask me questions while you tour the home.