400 N Broadway Nyack, NY 10960
Upper Nyack NeighborhoodEstimated Value: $1,049,002 - $1,387,000
4
Beds
3
Baths
2,734
Sq Ft
$449/Sq Ft
Est. Value
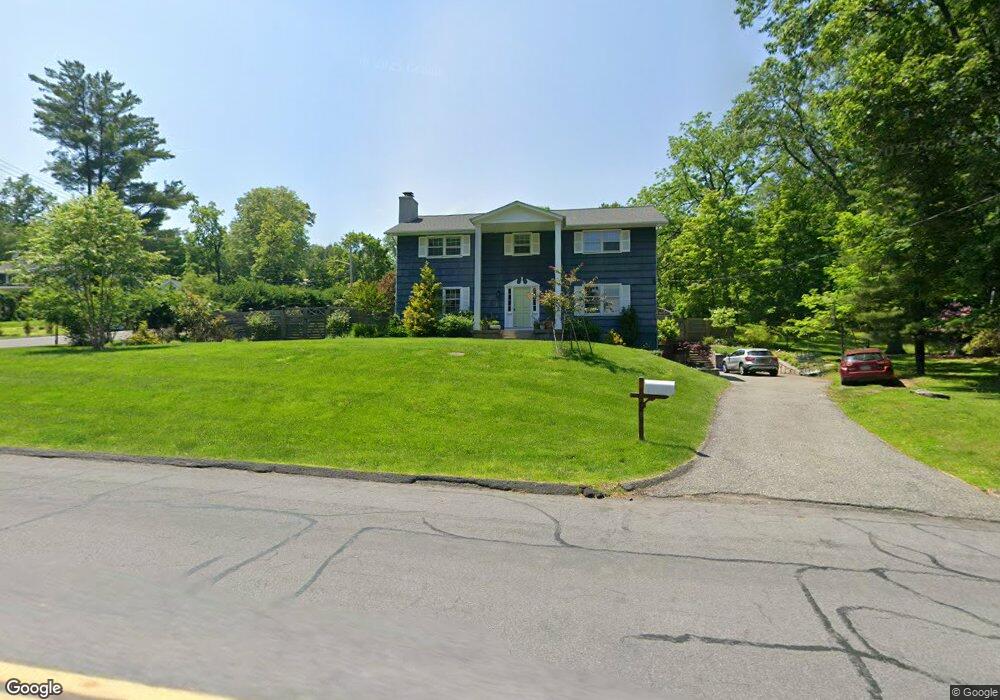
About This Home
This home is located at 400 N Broadway, Nyack, NY 10960 and is currently estimated at $1,227,751, approximately $449 per square foot. 400 N Broadway is a home located in Rockland County with nearby schools including Nyack Senior High School.
Ownership History
Date
Name
Owned For
Owner Type
Purchase Details
Closed on
Feb 9, 2017
Sold by
Grossbard Paul M and Grossbard Lillian S
Bought by
Grossbard Lillian S
Current Estimated Value
Purchase Details
Closed on
Jun 28, 2010
Sold by
Magaro Lisa
Bought by
Grossbard Paul M and Grossbard Lillian S
Home Financials for this Owner
Home Financials are based on the most recent Mortgage that was taken out on this home.
Original Mortgage
$586,500
Outstanding Balance
$392,842
Interest Rate
4.88%
Mortgage Type
New Conventional
Estimated Equity
$834,909
Purchase Details
Closed on
Jul 23, 2001
Sold by
Raoul Guy and Raoul Reine
Bought by
Magaro Lisa
Home Financials for this Owner
Home Financials are based on the most recent Mortgage that was taken out on this home.
Original Mortgage
$200,000
Interest Rate
6.87%
Create a Home Valuation Report for This Property
The Home Valuation Report is an in-depth analysis detailing your home's value as well as a comparison with similar homes in the area
Home Values in the Area
Average Home Value in this Area
Purchase History
| Date | Buyer | Sale Price | Title Company |
|---|---|---|---|
| Grossbard Lillian S | -- | None Available | |
| Grossbard Paul M | $690,000 | New Jersey Title Ins Company | |
| Magaro Lisa | $597,500 | Lawyers Title Insurance Corp |
Source: Public Records
Mortgage History
| Date | Status | Borrower | Loan Amount |
|---|---|---|---|
| Open | Grossbard Paul M | $586,500 | |
| Previous Owner | Magaro Lisa | $200,000 |
Source: Public Records
Tax History Compared to Growth
Tax History
| Year | Tax Paid | Tax Assessment Tax Assessment Total Assessment is a certain percentage of the fair market value that is determined by local assessors to be the total taxable value of land and additions on the property. | Land | Improvement |
|---|---|---|---|---|
| 2024 | $27,997 | $201,780 | $55,900 | $145,880 |
| 2023 | $27,997 | $201,780 | $55,900 | $145,880 |
| 2022 | $24,674 | $201,780 | $55,900 | $145,880 |
| 2021 | $24,633 | $201,780 | $55,900 | $145,880 |
| 2020 | $21,766 | $201,780 | $55,900 | $145,880 |
| 2019 | $20,057 | $201,780 | $55,900 | $145,880 |
| 2018 | $20,057 | $201,780 | $55,900 | $145,880 |
| 2017 | $19,060 | $195,700 | $55,900 | $139,800 |
| 2016 | $18,768 | $193,000 | $55,900 | $137,100 |
| 2015 | -- | $180,300 | $55,900 | $124,400 |
| 2014 | -- | $180,300 | $55,900 | $124,400 |
Source: Public Records
Map
Nearby Homes
- 407 N Broadway
- 345 N Midland Ave
- 417 Tompkins Ave
- 139 Castle Heights Ave
- 519 N Midland Ave
- 224 Birchwood Ave
- 320 N Midland Ave
- 523 N Midland Ave
- 503 Hudson View Rd
- 243 Birchwood Ave
- 530 N Midland Ave
- 112 Lexow Ave
- 203 Hilltop Dr
- 201 N Broadway
- 41 Village Gate Way
- 4 Francis Ave
- 210 Lexow Ave
- 2 Francis Ave
- 627 N Broadway
- 103 Gedney St Unit 3B
- 402 N Broadway
- 102 Birchwood Ave
- 350 N Broadway
- 104 Birchwood Ave
- 404 N Broadway
- 405 N Broadway
- 406 N Broadway
- 107 Birchwood Ave
- 346 N Broadway
- 106 Birchwood Ave
- 349 N Broadway
- 109 Birchwood Ave
- 414 N Broadway
- 344 N Broadway
- 2 Tompkins Ct
- 111 Birchwood Ave
- 6 Tompkins Ct
- 110 Birchwood Ave
- 4 Tompkins Ct
- 113 Birchwood Ave